The flattening of the yield curve has been much talked about lately and there will be plenty more talk in the coming months. For those new to this topic, the yield curve is most often represented by a chart with U.S. Treasury yields of varying durations - shortest on the left, longest on the right - at a particular point in time.
Readers are again directed to the always informative Dynamic Yield Curve over at StockCharts.com, where many hours can be spent investigating some of life's economic and financial mysteries.
 To the left is the yield curve as of March of 2003, around the time that U.S. equity markets hit their lows for the decade. Economic growth, as measured by real GDP, had gone negative for a few quarters in 2001 and 2002, and heading into 2003 was uncomfortably in the two percent range.
To make matters worse, job creation was anemic and people were talking about the dreaded "deflation" monster.
Still reeling from the stock market bubble and the 9/11 tragedy, growth, job creation, and inflation were much too low for the folks at the Federal Reserve.
While long term rates have held generally above 4 percent in the last few years, the 10-year note occasionally dipping into the 3 percent range, the difference between short term rates and long term rates has been at least two or three percent during this time.
This is a highly stimulative condition, as with no apparent limit to the amount of money available to be borrowed, many have seized the opportunity to borrow at low short-term rates, seek a higher return elsewhere, and pocket the difference. This is otherwise known as the "carry trade".
This has worked well in the U.S. until short term rates began rising last year - today it only works well in Japan, where short-term interest rates have been near zero for the better part of the last fifteen years, following the zenith-like rise of their economy in the 1980s.
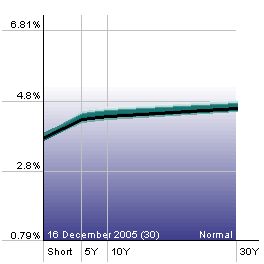
To the right is what the yield curve looks like today. The difference between long-term rates and short-term rates has narrowed precipitously since June of last year as short term interest rates have moved from 1 percent to 4.25 percent in a series of 13 quarter point hikes. During this time rates for the 10-year Treasury actually fell from 4.6 percent to 4.4 percent.
Thus the conundrum.
Why have long-term rates refused to move up as short-term rates have risen?
Why is this a conundrum? Why is this significant?
Because a continuation of the current trend will cause an inverted yield curve.
What's Wrong with an Inverted Yield Curve?
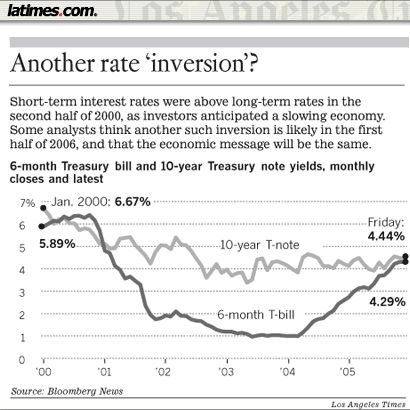
An inverted yield curve has been the single most reliable economic indicator in predicting coming weakness in the economy - it has, in fact predicted the last five recessions. In an article from yesterday's L.A. Times, Tom Petruno explains:
Normally, long-term interest rates are higher than short-term rates, which makes sense. If you're going to tie up your money for a lengthy period you would expect to be compensated for the risks that entails.
When short-term rates exceed long-term rates, an "inversion" is said to occur. The last one was in 2000: The Fed held its key rate at 6.5% in the second half of that year. But as the economy weakened, bond investors began to sense that the Fed soon would be easing credit. Long-term bond yields slid.
By the end of December 2000, the 10-year Treasury note yield was 5.11% — about 1.4 percentage points below the Fed's short-term rate.
The Fed began cutting its rate in January 2001, but it was too late. A recession began in March.
That has been par for the course, according to David Rosenberg, an economist at Merrill Lynch & Co. in New York. In the last three decades there have been five Fed-induced rate inversions, Rosenberg said.
"The economy slipped into recession a year later all five times," he said.
Hmmm...
"Too late" in cutting rates and "Fed-induced" rate inversions leading to recessions - that's not something that you hear a lot about. The Fed is supposed to be assuring things like price stability, maximum sustainable growth, and full employment, not "inducing" recessions by cutting rates too late.
In fact isn't "inducing" a recession really the domain of 1980s Fed Chairman Paul Volcker? Does anyone think of current Fed Chairman Alan Greenspan as inducing recessions? There have been so few recessions in the last 18 years, and comparatively mild ones at that.
But, back to the yield curve...
Given the course that has been taken for the last year and a half, and should current trends continue, an inverted yield curve would likely appear sometime in the first few months of 2006, as short-term rates move up to between 4.5 and 5 percent. It's been almost four years since the ten-year note was over five percent, and it shows little inclination of late of cooperating anytime soon. It seems the only way to avoid a rate inversion would be to stop raising short-term rates.
But, maybe this time it's different. Maybe an inverted yield curve in this new era of global trade and international finance is not such a big deal. The L.A. Times article continues:
This time around, however, no less than Fed Chairman Alan Greenspan himself has said that an interest-rate inversion might not signal an economic slowdown. The implication is that the bond market has its own special issues these days.
...
Some on Wall Street believe that demand for bonds has remained robust, keeping yields down, because of a global savings glut — meaning that so much money is looking for a place to go that investors in effect are forced to out-compete one another for bonds, depressing returns.
"So much money is looking for a place to go" - now on the surface it sounds like there could be a lot worse problems than having too much money. And, there is no question that U.S. debt is popular with our overseas trading partners, who coincidentally, on a monthly basis, have just about exactly the same amount of new savings as the U.S. has new debt. That is very convenient for a nation such as the U.S. that would much rather spend than save.
Some analysts also contend that bond yields have softened because the market believes inflation has been vanquished in the long run, the jump in energy prices notwithstanding. Government bond returns have averaged 2.3 percentage points above the inflation rate since 1926. If inflation falls back to, say, 2%, a 4.44% bond yield would look fairly generous.
So much money but so little inflation - inflation has been "vanquished in the long run" - a savings glut and low long term interest rates to keep mortgage rates low to enable the continuation of the world wide real estate boom.
Again, it's hard to see where the problems are here. What is everyone concerned about with this inverted yield curve?
It appears that we are living in the most perfect of all possible worlds. The only thing that doesn't make sense is why gold is rising so dramatically.
Read more...


![[Most Recent Quotes from www.kitco.com]](https://lh3.googleusercontent.com/blogger_img_proxy/AEn0k_sk0OPYFLa4hcEd27G5L5DAuW406ouIDkekAyAynmSNcwby4RBlX0mr_rXi8C6I6YZOEM6YltEvujRufr3GP4Dk8G4Yxi6VnSvawIH57MlB7zLSs3FD_Eq089uriF9y=s0-d)
![[Most Recent Quotes from www.kitco.com]](https://lh3.googleusercontent.com/blogger_img_proxy/AEn0k_uRQdJ4sX-9J_pPVs-hVV5z0pnuNtoCBiylY6YPSWyoqdKHelQe-FoMhzDRMOM88lkrG7le_LMAO4O2XgQmIlDtsbaKDuzcQo2Kn0Bx6TZ7MH4302lF45_F3Jdu8Sb9C9E=s0-d)
![[Most Recent USD from www.kitco.com]](https://lh3.googleusercontent.com/blogger_img_proxy/AEn0k_vcEWsiueD3ggQI-9F62KEMWdrZNIULydDvqTHrEpQCvVsK1o_71zuABouqzoLHWG8M2tjhzmggYEpA1nQ4QePZoBoq7r3O2lhQ3Onc0LJeEK1uEmKAXIiJ=s0-d)


 To the left is the yield curve as of March of 2003, around the time that U.S. equity markets hit their lows for the decade. Economic growth, as measured by real GDP, had gone negative for a few quarters in 2001 and 2002, and heading into 2003 was uncomfortably in the two percent range.

