

![[Most Recent Quotes from www.kitco.com]](https://lh3.googleusercontent.com/blogger_img_proxy/AEn0k_tO0hn-J4g4hHhb-korAYsGPZQPqXSl7pJz7wKbAGHjINCFxJq4-Jt5Pm6_SSfsDkYzhx4RjG2VnNmO7FMh3HC3CVUChpWdDw4yM2140ebm7CNc8MUCOqVmDZEbJvqn=s0-d)
![[Most Recent Quotes from www.kitco.com]](https://lh3.googleusercontent.com/blogger_img_proxy/AEn0k_vGJ5phAKFi6bSrb1xUYkwiuqY0OSflfMDLScj5oHovhBOoPuDgh3oH_WaO0gLe7Yk9vbb9_JITKsoPxRcs6dztR5soU2S1gAH4oLf1iexefrk45rpe5MhIs3BcUM8MXjE=s0-d)
![[Most Recent USD from www.kitco.com]](https://lh3.googleusercontent.com/blogger_img_proxy/AEn0k_s5ZQOO5wgG4ijH2PrHZicwPlnti2IhhYIRakrTVZsEkkKIuYHXiiDGtDPv9heA-7RTzoRET0L4zfvhqvW1B1-qO22BdKIEiOv3Z08RgP_TmNgaUNpUVWox=s0-d)

Just a Few Cartoons
Sunday, January 28, 2007
Once again, the fare from The Economist bests that offered up by BusinessWeek by a wide margin. What's up with the worker's arms in the BusinessWeek cartoon?



 Posts
All Comments
Posts
All Comments


Once again, the fare from The Economist bests that offered up by BusinessWeek by a wide margin. What's up with the worker's arms in the BusinessWeek cartoon?
Following is a summary of last week's economic reports. Mixed reports on new and existing home sales highlighted the data during a week that was relatively thin on economic news. For the week, the S&P 500 Index fell 0.4 percent to 1,422 and the yield of the 10-year U.S. Treasury note rose 11 basis points to 4.88 percent.
Existing Home Sales: Sales of existing homes fell in December after having risen in both October and November. Prior to the October rebound, sales volume has declined for seven consecutive months and 11 of the last 12 months going back to September of 2005. From the mid-2005 peak annualized rate of over 7 million housing units, current sales levels are down over 13 percent, having declined 10.8 percent in 2006.
Inventories are still quite high, easing from 7.3 months in November to 6.8 months in December and the number of unsold homes is 23 percent higher than a year ago. The median price was up 2.3 percent for the month and unchanged for the year at $222,000.
In an odd sort of commentary that probably speaks louder than any other words associated with the most recent data release, David Lereah, chief economist for the National Association of Realtors (NAR), said, "With fingers and toes crossed, it appears that we have hit bottom in the existing home market."
Fingers and toes?
New Home Sales: New home sales surprised to the upside in December rising 4.8 percent following a 7.4 percent increase in November. This marked the first back-to-back increases in almost two years and follows a period when volume declined in 11 of the previous 15 months. Inventory fell from 6.1 months in November to 5.9 months in December and prices rose modestly during the month. On a year-over-year basis, the median price was down 1.8 percent to $245,300.
While many observers will point to rising volume and stable pricing as signs of a rebound, this data does not include cancellations and builder incentives that would paint a much different picture. Cancellations, still unusually high at over 30 percent (much higher in some areas) are not added back into the builders' inventory and builder incentives totaling tens of thousands of dollars are commonplace.
Durable Goods Orders: The December report on durable goods manufacturing exceeded expectations, posting a 3.1 percent increase following an upwardly revised 2.2 percent rise in November. This follows wild swings of +7.8 percent in September and -8.3 percent in October, the continuation of a very volatile series where civilian aircraft production has a disproportionate impact on the monthly change. Overall, new orders for durable goods rose 2.6 percent in 2006, down from year-over-year changes of between five and fifteen percent earlier in the year, coming off of significantly lower levels in 2005.
Summary: The housing data paint a mixed picture of the real estate market during a time of year that often sees odd data reporting due to seasonal factors (i.e., volume is normally low at this time of year and unusual weather has an outsized impact on sales volume). Not much should be made of any of the housing news this week, save for the desperate tone of the NAR's chief economist.
In the mainstream media, reporting on both new and existing home sales focused on the year-over-year decline for 2006 - existing home sales fell 8.4 percent and new home sales were down 17.3 percent. This too seems to be much ado about very little as year-over-year data is available with each month's report - the December report carries no special meaning other than it concludes a calendar year. For purposes of assessing the current state of the housing market, undue emphasis on the year-over-year change in this month's reporting is a bit misleading.
The Week Ahead
In a busy week ahead, economic news will be highlighted by the first look at fourth-quarter GDP on Wednesday and the labor report on Friday. Other reports include consumer confidence on Tuesday, employment costs on Wednesday, personal income and the Institute for Supply Management's manufacturing index on Thursday, and factory orders on Friday.
[Note: This is one small part of the Weekend Update published at the companion investment website Iacono Research. Since it contains no investment-specific information, it will appear here on Saturdays on a fairly regular basis. To have a look at the complete Weekend Update, including the model portfolio and much more, sign up for a no-obligation free trial today.]
Chart courtesy of Northern Trust.
Earlier this morning, Google forced this blog to transition from "Old Blogger" to "New Blogger". There were no major problems until now. For some reason, the old method of editing the .html to get the full size version of an image in the main panel is no longer effective - now you have to click on it to get the bigger, less-fuzzy version that would have fit in the main panel.
That's progress.
Anyway, it was an interesting week for hard assets and the dollar. Thanks to some cold weather, kidnappings in Nigeria, and an announcement that the U.S. strategic petroleum reserve was being doubled, crude oil rose a dollar or so.


---
UPDATE - January 27th, 9:30 AM:
Better images are now available - hosted at the website. Bloggers days are probably numbered here - they've done things to simplify usage for the masses (understandable), but in the process, have made things much more difficult here.
This story from The Economist explaining the superior investment returns earned by endowment funds should serve as a lesson to those who watch too much CNBC and are too enamored with the latest "system" to trade stocks.
What makes America's colleges such good investors?
A healthy portion of unconventional investments, a long-term strategy, and paying little heed to the advice offered by the faculty in their economics department are all key factors.AMERICA is the home of the efficient-market hypothesis, which says financial markets have become so keenly contested that it is impossible for investors to keep beating them. Yet the very universities that peddle this theory so confidently also gleefully undermine it by doing precisely that: over one year and over ten, their endowment funds beat the S&P 500 and hammer most other institutional investors, including pension funds.
Recall that Mr. El-Erian hails from PIMCO, the world's largest bond trading company, one of the first companies to provide a retail product in the commodities sector with their PIMCO Commodity Real Return fund (PCRCX).
The final figures for the most recent fiscal year will be out next week. But according to preliminary numbers from the National Association of College and University Business Officers (NACUBO) and TIAA-CREF, a financial-services group, university endowments made an average return of 10.7% in the year to June 30th 2006, net of fees and expenses.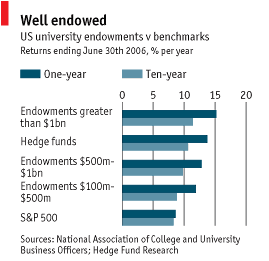 The biggest endowments are big investors: between them, Harvard and Yale have some $50 billion, around one-seventh of the total. They tend to do better than their smaller peers and pretty much everyone else. Indeed, these eggheads even beat the quants. Endowments larger than $1 billion returned 15.2% on average last year, more than the main hedge-fund index (see chart). The best-performing endowment in 2005-06, which belonged to the Massachusetts Institute of Technology, gained a handsome 23%. That put it a whisker ahead of Yale's (22.9%), run for more than 20 years by David Swensen.
Endowment managers would no doubt like to claim this is all down to skill. But they do enjoy certain advantages over their rivals. In principle, their investment horizon lasts not weeks, months or years, but forever. Their capital is extremely patient. Each endowment has a single client—itself—that needs to extract only a small sum annually to keep the wheels of scholarship turning. Therefore, unlike pension funds, they do not have to fret about matching assets with liabilities. This means endowments can tolerate lots of volatility, which in turn allows them to make, and stick to, contrarian bets. They have been “incredibly gutsy” in going against the grain, says Will Wechsler of Greenwich Associates, a financial-services consultancy. Perhaps they can stay solvent longer than the market can stay irrational.
A second advantage is the university environment. “Whereas pension trustees are naturally risk-averse, universities are all about innovating, financially as well as intellectually,” says James Walsh, who runs Cornell's $5 billion endowment. Investment constraints are kept to a minimum. Alumni with Wall Street experience are encouraged not only to donate money but also to sit on investment committees. Many are happy to oblige. “This gives us access to minds we couldn't otherwise afford,” says Mr Walsh. The brainpower on tap at the university itself is not always as useful. According to one former Harvard official, its endowment fund has done so well because it has avoided taking advice from the economics faculty.
Put these factors together, says Mohamed El-Erian, Harvard's endowment chief, and you have a recipe for “thinking more boldly than the pack”.
In September it was announced that the Harvard fund intended to increase their exposure to "real assets" by shifting another $1 billion into commodities - from an allocation of 13 percent to 16 percent of the fund.
While it is not known with any certainty, the Harvard fund likely utilizes a commodity investment approach similar to the PIMCO fund - commodity futures backed by inflation protected treasuries. This is the same approach now available to retail investors through a plethora of new commodity ETFs, the most recent additions being the seven funds launched earlier this month by PowerShares/Deutsche Bank:
In recent years, commodity investments have been a contributing factor in the superior performance of many endowment funds.America's endowments were among the first to look beyond the staid mix of domestic equities, bonds and cash. The idea they helped develop in the 1970s and 1980s—deemed eccentric at the time—was to break the portfolio into a mix of standard and “alternative” assets, as uncorrelated with each other as possible so as to spread risk. This strategy is sometimes referred to as “portable alpha”.
It's hard for most individual investors to go against the crowd.
Their early moves into hedge funds, venture capital, private equity, property, distressed debt and the like brought outsized profits. Universities and foundations have also benefited from geographical diversification, especially into emerging markets. Foreign equity was their best-performing asset class last year, making 24.7% according to a survey by the Commonfund Institute, which manages pooled investments. Endowments have also revolutionised commodities. By making a killing in “hard” assets like timber in recent years, the universities have helped to turn them from industrial assets to financial ones in investors' eyes. Harvard keeps three lumberjacks on its team, the joke goes.
Indeed, for university endowments to call all of these assets “alternative” is something of a misnomer. It is assets such as government bonds, once safely in the mainstream, that must fight for their place in university portfolios. Today the typical large endowment has 41% of its holdings in assets other than shares, bonds and cash, says NACUBO. In the past couple of decades, illiquid investments, which are less efficiently priced than liquid ones, have rewarded those brave enough to buy them.
There is sufficient quandary in managing a portfolio of your own without having to think about "alternative" investment classes. But, as demonstrated by the fund managers at Harvard and Yale, for those willing to go against the crowd, there are rewards.
Disclosure: The author is long PCRCX and DBE. He has no positions in any other stocks mentioned in this report.
A link to this story was posted in the comments section the other day. It begged for more attention and an image to go along with the words from Francois Velde, a senior economist at the Chicago Fed ... to enhance the reading experience.Coin shortage could turn pennies to nickels
Again, readers are referred to the always informative Coinflation website for more details on metal content and melt values.
A potential shortage of coins in the United States could mean all those pennies in your piggy bank could be worth five times their current value soon, says an economist at the Federal Reserve Bank of Chicago.
Sharply rising prices of metals such as copper and nickel have meant the face value of pennies and nickels are worth less than the material that they are made of, increasing the risk that speculators could melt the coins and sell them for a profit.
Such a risk spurred the U.S. Mint last month to issue regulations limiting melting and exporting of the coins. But Francois Velde, senior economist at the Chicago Fed, argued in a recent research note that prohibitions by the Mint would unlikely deter serious speculators who already have piled up the coinage.
The best solution, Velde said, would be to "rebase" the penny by making it worth five cents rather than one cent. Doing so would increase the amount of five-cent coins in circulation and do away with the almost worthless one cent coin.
"History shows that when coins are worth melting, they disappear," Velde wrote.
"Rebasing the penny would ... debase the five-cent piece and put it safely away from its melting point," he added.
Raw material prices in general have skyrocketed in the last five years, sending copper prices to record highs of $4.16 a pound in May. Copper pennies number 154 to a pound. Prices have since come down from that peak but could still trek higher, Velde said.
Since 1982, the Mint began making copper-coated zinc pennies to prevent metals speculators from taking advantage of lofty base metal prices. Though the penny is losing its importance -- it is worth only four seconds of the average American's work time, assuming a 40-hour workweek -- the Mint is making more and more pennies.
Velde said that since 1982 the Mint has produced 910 pennies for every American. Last year there were 8.23 billion pennies in circulation, according to the Mint.
"These factors suggest that, sooner or later, the penny will join the farthing (one-quarter of a penny) and the hapenny (one-half of a penny) in coin museums," he said.
Readers are also left to wonder about the condition of the nation's monetary system when the melt value of base metal coinage exceeds its face value. According to the table below, the current nickel appears to have a more serious problem than the penny.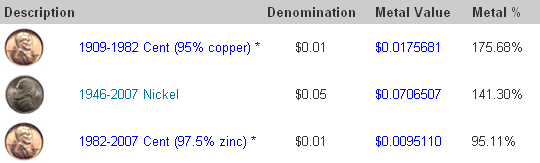 Leading the list of coinage that has "disappeared" from circulation because of its high melt value is the 1945 nickel, a five-cent piece that contained one-third silver.
The value of its metal content today is 75 cents yielding a cool 1,300 percent gain for anyone who dares defy the new regulations from the U.S. Mint.
In many ways, the United Kingdom is a miniature version of the U.S. They too are one of the few Anglo Saxon countries having an outsized trade deficit and budget deficit, they are graced by an enormous housing bubble, they are one of the world's great financial centers, and their population is accustomed to a position near the top of the heap of world powers.
Another very important similarity between the two countries is a festering inflation problem that no longer seems to be quelled by cheap imported goods from Asia and moderate energy prices.
In many ways, rising prices are much more acute in the U.K. than in America.
With a rapidly growing world financial center in London, the country has been a popular destination for those with petro-dollars to spare. And what appeared to be a bursting housing bubble a year ago has been reinvigorated - with home prices again rising at double-digit rates (closer to triple-digit rates in tonier areas), it now looks more dangerous than ever.
In recent years, the government agencies charged with maintaining confidence in the currency have been successful in continuing to report low single digit price increases. Aided by excluding or reweighting one thing or another and by undergoing ever more severe contortions in the actual calculations, reported inflation has remained tame.
In 2006, Everything Changed
Earlier this month, prompted by continuing concern from many corners that the government's inflation statistics are not consistent with real-world experiences, the Office on National Statistics (ONS) made available a personal inflation calculator.
It was a big hit.
Some families found that their personal inflation rate was closer to 10 percent while at the same time the new tool was criticized for not including sharply rising education costs. Just before it became official that inflation had jumped to a ten-year high, the Bank of England surprised nearly everyone by hiking short-term interest rates by a quarter point to 5.25 percent.
Bank of England Governor Mervyn King was on top of things. Foreign currency traders liked what they saw and the currency strengthened.
The Brits have two official figures for inflation. Their Consumer Price Index rose from 2.7 percent to 3.0 percent in December, driven higher by rising energy prices. The separate Retail Prices Index, which includes mortgage payments, rose from 3.9 percent to 4.4 in December.
These are terrifying numbers for central bankers.
The CPI reading came a whisker short of the 3.1 level that would have required Mr. King to pen a letter to Chancellor of the Exchequer Gordon Brown explaining why the Monetary Policy Committee missed the two per cent inflation target by more than a full percentage point.
The impromptu interest rate hike caused the banks to withdraw fixed rate mortgages from the marketplace, bankers apparently fearing that rates would go higher still. Prospective homeowners and those looking to refinance were not pleased.
The Telegraph is on the Case
The staff at The Telegraph newspaper then did some more tinkering with the government's new inflation calculator and found that "personal" inflation rates were much higher than the government's official number - at least in the cases they featured in their report.
Allison Lauder, a 32 year old solicitor had a calculated personal inflation rate of 7.4 per cent versus the ONS figure of 4.4 percent. John Yates, age 77 and retired, registered 7.5 per cent versus the ONS's estimate of 3.9 per cent. And Niki Chesworth, a 44 year old freelance journalist and her partner, Guy, a 45 year old engineer, posted a personal inflation rate of 8.7 per cent, double the figure from the ONS.
Naturally, Mervyn King scoffed at the notion that the government understates inflation.
Gordon Brown stepped in to take some responsibility for the "inflation mess", and then the graphics department at The Telegraph just got a bit silly in a piece titled, "Be a winner at the great inflation race". The report urged the fixed-income set to start taking on a bit more risk for a better return - for those willing "to take the plunge, stock market investments provide a better chance of outpacing inflation." No promise of victory was made.
The image above has the same feel as that Inflation Monster cartoon put out by the EU about a year ago - something about capturing the little bugger and sealing him in a jar to make the world a better place.
This sort of thing really isn't very funny, especially if you're a pensioner (retiree). Almost five million seniors in the U.K. live on less than £10,000 a year (approximately $20,000) with one-fourth of pensioners counting the £4,381 ($9,762) full basic state pension as their only source of income.
Each year, pensioners fall a little further behind.
Another piece urged savers to Wave goodbye to inflation by seeking higher yielding fixed income investments. This task seems to be made even more difficult as other measures of inflation come to light. According to investment bank Barclays Capital, a simple index of "essential inflation" jumped to 8 percent in 2006 - this measure includes such essentials as food, property tax, utilities, and gasoline.
For many the numbers just don't add up. It's a losing battle - a race that can't be won.
It seems that the only way to get the better of inflation is to take on a level of risk that most people, understandably, are reluctant to do. And it's probably going to get much worse - in both the U.K. and in the U.S.
It didn't have to be this way.
DataQuick released the quarterly foreclosure data for Southern California earlier today - here's the breakdown by county: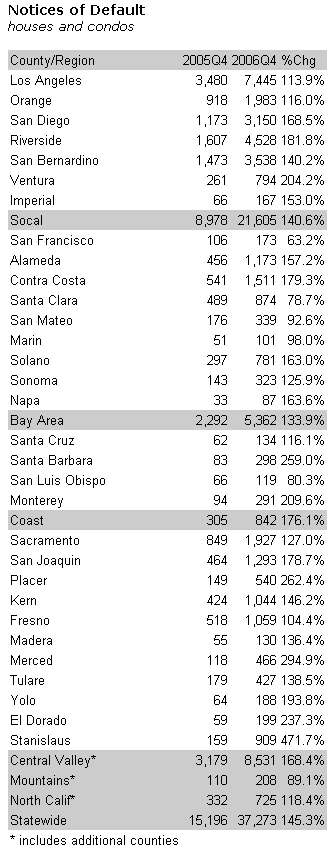 That's a lot of three digit percent increases.
You can look up population data by county for California at the Census Bureau - based on the 2005 population estimates, Riverside County appears to be the most distressed area in Southern California. San Bernardino is not far behind.
From the news release:Most of the loans that went into default last quarter were originated between January 2005 and February 2006. The median age was 15 months.
Here's the chart from the LA Times story discussed earlier today. Remember, there are still lots of adjustable rate mortgages due to reset this year.
On primary mortgages, homeowners were a median five months behind on their payments when the lender started the default process. The borrowers owed a median $10,555 on a median $324,000 mortgage.
On lines of credit, homeowners were a median six months behind on their payments. Borrowers owed a median $3,582 on a median $60,000 credit line. However the amount of the credit line that was actually in use cannot be determined from public records. Also from earlier today:
"So far, this isn't alarming," said John Karevoll, chief analyst at DataQuick Information Systems, which compiled the data. But if default notices "keep going up at this rate, it could get nasty fast," he added.
Again, what about this data is not alarming?

© Blogger template Newspaper by Ourblogtemplates.com 2008
Back to TOP


