Wikinvest Wire

Me and My Blog

Saturday, September 17, 2005

This bit of information is being provided for first time readers who may be curious or confused about what it is they are reading here in this little corner of the blogosphere.

Who am I?

I am a retired software engineer in my mid-forties, living in Southern California. This blog is a vain attempt to stave off a mid-life crisis, and I'm really hoping that it's going to work. Every time I pass by one of those BMW or Porsche dealerships, I think to myself - just go home and write something, you'll thank yourself in the morning...

No, that's not really why I write this. The real reason that I write this blog is that a few years ago, I developed a healthy curiosity about personal finance, financial markets, macroeconomics, and economic history after witnessing the rise and fall of my retirement and investment accounts during the stock market bubble and bust.

This is where it has led.

Long ago, I was accepted to college as an engineering major, then I switched to business, then I took a microeconomics class, and then I quit school. The microeconomics class had little to do with me leaving, but upon returning to school, I changed my major back to engineering. I finished school and went to work as an engineer, devoid of any thoughts related to micro or macroeconomics for the better part of twenty years.

The bursting of the Nasdaq bubble got my attention. I began to read all that I could via the internet - mainstream financial news, government websites, and many alternative sources of financial news. I quickly determined that the alternative sources of financial news made a lot of sense to my engineering mind, unencumbered as it was, with mainstream contemporary economic thought.

Major influences have been Financial Sense Online, The Daily Reckoning, Prudent Bear, The Ludwig Von Mises Institute, and many others - see the links to the right.

What am I doing?

The purpose of this blog is to help shed light on the underbelly of today's economy and to have a few laughs along the way. It seems that the entire world is being led along by government officials, central bankers, economists, and the mainstream financial media, most of whom seem to have some sort of vested interest in not providing a complete picture of our economy and our financial markets.

There are a growing number of individuals, like myself, who are trying to tell the world that the GDP, CPI, and employment statistics are not what they appear to be - that there is an inherent bias (to put it nicely) in the reporting of our economic condition, and that maybe things are not as others would like for you to believe.

It seems most people have not the time, the ability, and the inclination to look past the headline economic statistics, the current issue of their favorite personal finance magazine, or the current market value of their home - they don't smell anything funny.

Along with a growing number of other writers, I believe that our economy does smell funny. In fact "smell" isn't really the right word - it's more like a "stench".

Primarily, this stench has to do with massive amounts of debt everywhere, out-of-control government finances, the poor quality of job creation in recent years, and most importantly, a stock market bubble that morphed into a housing bubble.

Most people do not yet smell the stench - some are just now starting to get a whiff of it.

What's up with the name?

One of the first things you have to do when you create a blog is to give it a name. Then you have to announce yourself to the rest of the world with your first post - something like, "This is my first post". Many people stop there.

What I really wanted for the name of this blog was something like "Our Economy", because I wanted to be able to write about anything having to do with the economy or financial markets. But how dull would a name like that be?

Then I thought, "Well, what word best describes our economy?"

To me, clearly, today's economy is a mess. Most people don't realize it yet, but they are beginning to understand that all is not well. Soon, more people will be referring to this economy as a mess.

The next question is, "Who made this mess?"

While Federal Reserve Chairman Alan Greenspan is not solely responsible for the condition in which we find ourselves, he, more than any other individual, should get the credit or blame for what happens in the world economy in the next few years.

I, like many others today, believe the coming years will not be pretty - that we will all be living with the mess that Greenspan made for years to come.

I may be wrong. We'll see.

Read more...

Two Percent Inflation

Friday, September 16, 2005

From yesterday's Bureau of Labor Statistics Consumer Price Index Summary we learned that consumer prices rose 0.5 percent in August, which, when added to the previous 11 months works out to be a 12 month increase of 3.6 percent.

Now, everybody just calm down ...

Yes, this number is getting dangerously close to 4 percent, but there is no need to be alarmed. Core inflation, which strips out volatile food and energy costs, moved up just 0.1 percent and was a docile 2.1 percent during the last year.

Fasting pedestrians and bicyclists have nothing to worry about.

If you need more convincing that you shouldn't be worried about prices that seem to be rising everywhere but at Wal-Mart and in the inflation statistics, take a look at the Median CPI over at the Cleveland Fed - a monthly increase of 0.2 percent and an annual rise of 2.1 percent.

See? Now there are two measures of inflation at 2 percent and just one closing in on 4 percent. This is what's called benign inflation, or more accurately, benign inflation reporting - a key ingredient to the monetary policy mix over the last decade or so.

The Number Two

It seems there is something that is just magical about 2 percent inflation. Or, maybe it's just the number two - kind of like 2 percent milk, we suppose. Non-fat milk looks too watery to be very tasty and there are too many calories in whole milk, but 2 percent milk ... why, you can drink as much of that as you want and it tastes good.

Two percent - it's kind of like zero percent, really. Two is so harmless and benign - "my two cents", "two bits". And, harmless and benign is how we like our inflation reported. As long as people hear "inflation" and "two" in the same sentence over and over and over, maybe they can continue to not pay too much attention to rising prices all around them.

We have our own thoughts about benign inflation as we discussed some time ago here. It seems that in addition to the well known housing misinformation and quality adjustments in the CPI, there is the curious relationship between falling prices for imported goods manufactured in China and rising prices for services provided in America - they seem to neatly offset each other.

John Williams also has a nice analysis of some of the flaws in CPI here and Jim Puplava did a fine job in his discussion of the Core Rate here.

When Will They Notice?

The question today, and for the foreseeable future, is when will ordinary Americans notice that what they hear about inflation and what they experience in their daily lives bear (or is it bare?) little resemblance to one another?

Maybe soon.

If you are making nine dollars an hour working at Wal-Mart and now it costs you $60 to fill up your tank instead of $30 or $40, that's a difference of a half a day's wages after taxes. That should be noticeable - Wal-Mart customers have noticed it.

When times are good and you can whip out a credit card or debit card and fill up your tank for $30, then go buy groceries at reasonable prices, people tend to not look too closely at receipts. Many people don't bother to look at the total cost at the time of purchase or at the end of the month. Have you ever noticed the gas receipts left behind by motorists who seemingly couldn't care less about what they paid?

When you think about it, why would anyone pay any attention to a few extra dollars here or there, or another hundred dollars or so at the end of the month when home values have been rising as they have in recent years? When you've got an extra thousand or ten thousand in home equity at the end of the month, why would anyone notice monthly expenses that continue to rise month after month - medical expenses, tuition, gasoline, heating oil, utilities?

Just pay the bills and get on with the serious business of figuring out what to do with all that home equity that is just sitting there.

With rising short term rates affecting both HELOC payments and ARM adjustments, doubling of minimum credit card payments next month, rising gasoline costs, rising heating costs this winter, and stagnating home prices in some areas, many people will soon realize that while they can still believe that their milk is 2 percent, they won't continue to believe that their inflation is 2 percent.

Read more...

The Time Is Surely Not Far Off

Thursday, September 15, 2005

As gold makes attempt after attempt to once again surpass and hold the $450 per ounce mark and then take out the $457 level that marked a new 18 year high last December, more and more commentaries about the yellow metal are popping up in all sorts of places. Somehow these recent commentaries are different.

It used to be that there were only two sides to the gold story - the story told by economists and the story told by gold bugs.

The economists would say that gold is a "barbarous relic" that pays no interest and has been relegated to its proper place as but a footnote in history - that today's financial wizards are wholly capable of managing fiat money and that the world is a better place without the restrictions on money creation that were in place when money was linked to gold.

The gold bugs would respond by pointing out that today's fiat money has no intrinsic value because it is backed by nothing other than confidence in the government and the central bank which issues it - that ultimately, it will revert to its intrinsic value because of promises politicians can not keep and the hubris of central bankers.

Today there seems to be a growing middle ground when it comes to gold. Some question the current relationship between the oil price and the gold price and note that it is far from historical norms. Others wonder why gold has nearly doubled in value since the technology boom went bust and real estate became the world's primary driver of wealth creation.

An excellent example of this new middle ground is this Buttonwood column that appeared in The Economist the other day. This excerpt makes clear that at least one economist at The Economist is a bit perplexed with his current understanding of gold's place in the world. The writer seems less perplexed about gold's future.

Just as inflation has, until now, lain low, and gold with it, America’s dollar has also been resisting arrest. Gold is after all a monetary metal, an alternative to the paper currency that replaced it at the heart of the world’s trading system, when times are tough. But they haven’t seemed tough so far. Despite America’s famous twin deficits, everyone else’s currency has been even less appealing, and big exporters such as China have had their own reasons for propping up the dollar. Now, as Katrina heaps billions on a national debt that is already close to $8 trillion, might that perception change? The time is surely not far off.

For at the end of the day, the price of gold reflects confidence, more than anything. When people are confident that their central banks will control inflation while permitting the economy to grow, when they believe that paper assets are worth something approaching their face value, they buy gold to wear but not to put in a safe. Alan Greenspan has achieved the remarkable feat of suspending disbelief in America’s gerrymandered finances for the past few years. On his departure, watch the gold price soar.
What do we think? We think everyone should own at least two one ounce gold coins so that occasionally they can be held in one hand - to appreciate the density and the weight, to admire the luster, and to hear the sound that is made when precious metal comes in contact with precious metal.

We also think a number of coins far greater than two would be preferable to just two.

As we write this today, gold has once again topped the $450 mark and looks to soon be making new 18-year highs. Then it's on to new 25-year highs in the $500 range, at which point, we sense that the world will start noticing gold in a big way, regardless of what economists say.

Got gold?

Read more...

Los Angeles Overtakes San Diego

Wednesday, September 14, 2005

Los Angeles has finally overtaken San Diego in median home price - that's what yesterday's DataQuick report on August Southern California real estate sales shows. Not since the summer of 1999, when the median home price in Los Angeles and San Diego were both about $200,000, were prices for these two counties so close.

It seems funny to even type that last sentence - just to have "median home price", "Los Angeles", and "$200,000" all in the same sentence seems very strange.

It's only been six years - from $200,000 to $500,000.

What a country! What monetary policy! What lenders!

The median home price charts for all Southern California counties have been updated to include the August sales data. Data going back to 1999 is now included, and once again this month, San Diego is the laggard in price gains, with most other counties still going strong.


Click to enlarge

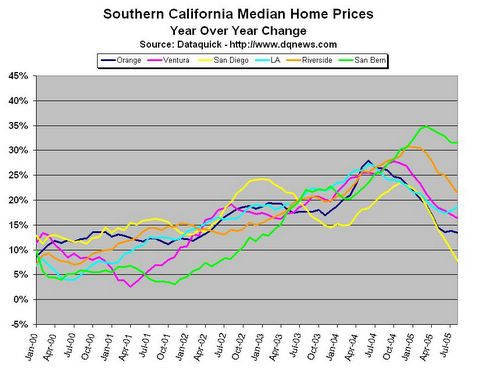
The year-over-year change in median home price chart (below) has also been updated to add four years - it now goes back to 2000. Of note here is that San Diego is now boasting a sickly 2% year-over-year price increase from last August.

We've previously projected October for San Diego to cross into negative territory. That will be odd - the last time a Southern California county had a negative year-over-year price change was in Ventura County back in early 2001.

Recall that it was December of 2000 when the Fed Funds rate began its descent from what at the time seemed like a rather ordinary level of 6.5%. By December 2001, the Fed Funds rate was 1.75%, a year later it was 1.25%, and a year after that it was 1.00%.

The chart clearly shows how yearly housing appreciation went from the 10% range in 2000 up into the 20-30% range once the low rates kicked in.


Click to enlarge

This next chart is a five month moving average of the above chart. In addition to being a lot less cluttered and generally easier to look at, a few trends begin to emerge. Trends that are clear are the price action in 2002 and again in 2004 - both these periods have rapidly rising year-over-year appreciation, while 2003 looks to be the year when everyone took a break.

It would be interesting to see the 10 year treasury yield plotted against these price changes. The year 2002 is when the low rates first affected the housing market, but the period of early 2004, if memory serves, was the period when the Japanese printed up enough Yen to buy around $300 billion in U.S. Treasuries, single-handedly forcing long rates back down below 4%.

Last year was also the time when lenders began to get really creative, after things seem to have leveled off a bit the year prior.


Click to enlarge

Next is a ten month moving average of the same data. Not much different really, just smoother. We can clearly make out some interesting relationships between lines of different colors - again the yellow line is of particular interest, but the green line is intriguing as well.

First, it is clear that San Diego was the leader in price appreciation from early 2000 until mid 2003. While San Diego was gaining at a rate of 15% a year, most other counties were in the 10% range. San Diego was the first county to break through the 25% barrier, but since mid 2003, it has been lagging all other counties.

Low priced San Bernardino County is almost the opposite of San Diego County in price patterns - it languished during the heady San Diego years early in the decade, but since mid 2003, San Bernardino is the clear leader. Three years ago, the ratio of San Diego median home price to San Bernardino median home price was more than 2-to-1. Last month, for the first time since this data series begins in 1999, it is less than 1.5-to-1.


Click to enlarge

What does all this mean? Who knows? Whatever it means, it's not good for San Diego.

Sure they're building more condos in San Diego, and there are probably other factors in play here, but we're talking about 4000-5000 home sales per month for most of these counties, and the fact remains that for markets of comparable sales volume, the trend is unmistakable - the boom has left San Diego and if any real estate markets go bust in this part of the country, San Diego will likely be the first.

One other thing to consider here is that the price changes may really be worse than indicated on these charts. With the ever increasing size of new homes being built these days, there is a natural upward bias in home prices (e.g., if price per square foot remained steady, home prices would go up due to increased square footage).

Also, as many Southern California homeowners have tapped their home equity for various home improvement projects in the last few years,
in many cases many tens of thousands of dollars, when these homes are resold, these improvements also have an upward bias to sales price.

That yellow line is just fascinating to watch every month.

Read more...

Back At It ... Kind Of

Tuesday, September 13, 2005

Well, no surgery yet, but another doctor and another exam.

Feeling a lot better than I've felt for the last week, mostly because today's doctor really seemed to know what he was doing. I guess that's the way it's supposed to work when the general practitioner refers you to the specialist. In fact, today, the specialist seemed a bit bored with the whole situation.

Boredom from the specialist is a good thing - that means it's routine (I think).

When the general practitioner says things that sound a little strange, and he seems to have difficulty diagnosing a fairly common condition (inguinal hernia) that is corrected with fairly common surgery, and then you have to wait a week for insurance approval and the appointment with the specialist ... your mind can do strange things.

It's good that the specialist was bored today.

Anyway, I will be posting on an irregular basis for the next few weeks until the surgery is done and the black and blue marks go away. After that it will be back to the Monday thru Friday routine.

The new Dataquick real estate sales data for Southern California is out today, so I'm in the process of updating the charts and will have something new and (hopefully) interesting in the morning.

Thanks for all the comments and emails.

Read more...
IMAGE

  © Blogger template Newspaper by Ourblogtemplates.com 2008

Back to TOP