Wikinvest Wire

The Week's Economic Reports

Saturday, January 20, 2007

Following is a summary of last week's economic reports. Consumer sentiment at three-year highs highlighted a week of mostly positive reports - the uptick in both producer and consumer prices is likely to prove temporary given the recent slide in energy prices. For the week, the S&P 500 Index was unchanged at 1,431 and the yield of the 10-year U.S. Treasury note was unchanged at 4.77 percent.
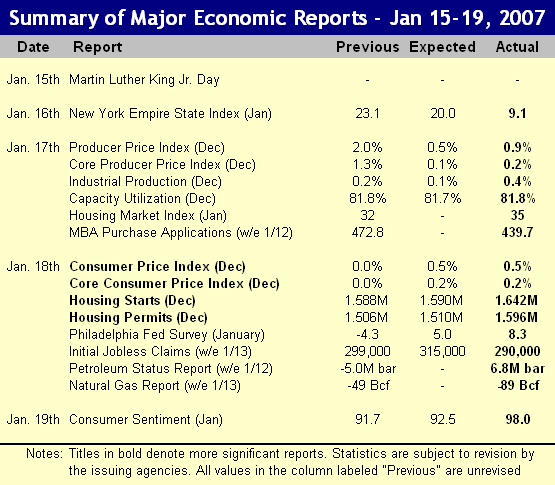
NY Empire State Index: The Empire State index fell from the mid-20s level of the last three months to just 9.1 in December indicating a manufacturing slowdown in the New York region (at least for the month). This was the lowest reading since the months of April and May in 2005 and, prior to that time, you'd have to go back to 2003 to see a reading this low. Declines were paced by new orders and inventories while prices increased slightly.

Producer Prices: Producer prices for finished goods increased more than expected in December, the overall index rising 0.9 percent after a 2.0 percent gain in November. Core producer prices, excluding food and energy, rose only 0.2 percent after jumping 1.3 percent the prior month. For the year 2006, overall producer prices were up 1.2 percent and the core rate rose 2.0 percent.

As would be expected from looking at the most recent monthly change, most of the latest increase occurred in food and energy. The energy price index rose 2.5 percent led by heating oil (up 4.0 percent) and gasoline (up 0.7 percent) - both of these increases are expected to be reversed in the next report. The food price index rose 1.7 percent led by a sharp increase in the price of fresh fruit and vegetables (up 21.7 percent), costs that are sure to go higher as a result of crop loss in California over the last week.

Industrial Production/Capacity Utilization: Industrial production exceeded expectations in December, rising 0.4 percent, while capacity utilization stayed level at 81.8 percent. Production gains were paced by durable goods including automobiles and computers, motor vehicle output rising 2.6 percent in December after a 3.4 percent gain in November.

Housing Market Index: The home builders' housing market index posted its third gain in the last four months after bottoming in September at 30. The September mark was a 15-year low after eight consecutive months of decline. Much of the uptick must be due to bouncing off of such a low level as home builders continue to face major problems with inventory, pricing, and land option write offs. Present sales have improved, largely a result of huge incentives and price reductions, while warm weather contributed to an increase in traffic of prospective buyers.
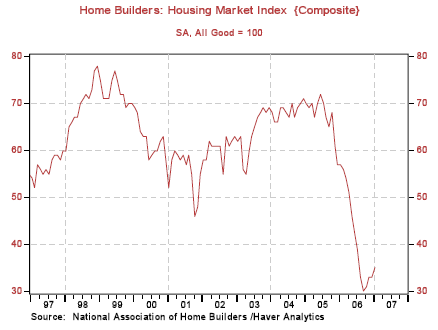
Consumer Prices: Overall consumer prices rose 0.5 percent in December and the core rate of inflation was 0.2 percent - this follows no change to either measure of inflation during the month of November. For the entire year of 2006, the Consumer Price Index (CPI) rose 2.6 percent after increasing by 3.4 percent in 2005. Core inflation was also 2.6 percent in 2006 versus 2.2 percent in 2005.

Rising energy prices boosted the overall price index in December, the energy index increasing 4.6 percent led by gasoline and natural gas prices that rose 8.0 percent and 3.9 percent, respectively. Much of this will be reversed in next month's report since most energy prices have fallen dramatically since the December reporting period ended. For the year 2006, energy prices rose 2.9 percent versus an increase of 17.1 percent in 2005.

In December, price increases were seen for transportation and apparel, up 1.8 percent and 0.6 percent, respectively. Within the housing component (comprising 40 percent of the overall index), rental prices increased 0.5 percent and owners' equivalent rent rose 0.3 percent. Offsetting these increases, prices for new cars fell 0.2 percent along with airline tickets that were down a full 1.0 percent.
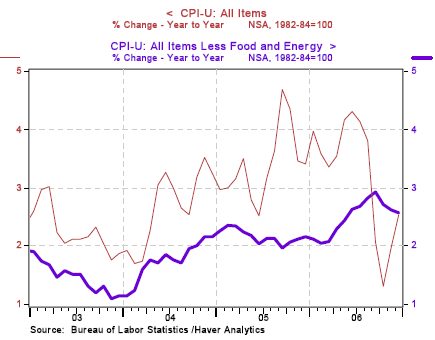
It really is hard for people to understand the inflation figures provided by the Bureau of Labor Statistics - what has happened in the U.K. over the past few months is likely a preview of coming attractions here in the U.S. After a growing number of individuals voiced their concern that the government's inflation numbers do not represent their real-world experience, The Telegraph took up their cause and, soon after, a personal inflation calculator was added to the government's website. Using this calculator, individuals can enter their own consumption data and a "personal inflation rate" is calculated.

An initial report from The Telegraph shows "personal" inflation rates as multiples of the government's overall inflation rate, with seniors hit particularly hard. As expected, government economists scoffed at the results.

A personal experience is worth sharing here as well. The same turkey on wheat sandwich (no cheese) that I've been buying for many, many years now has gone from $2.70 to $3.40 in just the last few years. That is an increase of more than 25 percent or two to three times the reported rate of inflation during that time. Lunch entrees are now around $6, up from below $5 a few years ago, and it is amusing to see the look on the faces of visitors who spend almost $10 for an entree, a soda, and a cookie - in a cafeteria.

If it weren't so difficult for people to assess how prices are rising all around them there would be many more complaints, however, if events in the U.K. are any indication, look for "inflation unrest" here in the U.S. before long.

Housing Starts: Warm weather contributed to a healthy 4.5 percent rebound in housing starts for the month of December. The total of 1.642 million units rose substantially from the downwardly revised level of 1.572 million in November, however, gains were restricted to multi-family construction as the number of single family homes built continued to fall. For the year 2006, total housing starts were down 24.7 percent.

The number of permits issued for new home construction rose 5.5 percent in December, following almost a year of monthly declines. For the year 2006, permits were down 24.3 percent. Those cheering the headline for this report as confirmation that housing has bottomed will surely be disappointed as unseasonably warm weather skewed the data and single family home construction continued to decline. With the onset of an arctic chill in much of the country, a reversal may be in store next month.

Philadelphia Fed Survey: After wallowing in negative territory since September, the Philadelphia Fed's survey of regional manufacturing activity surprised to the upside in January registering 8.3 following a December reading of -4.3. New orders gained and shipments increased sharply while most other categories were about flat.

Consumer Sentiment: The outlook from consumers has improved dramatically since bottoming last summer in the low 80s. Excluding months affected by Hurricane Katrina in 2005, last summer's readings on consumer sentiment were the lowest since early 2003, the recent rise no doubt a result of lower energy costs. The current level of 98 is a three-year high and was driven largely by a hefty rise in the expectations component, the public now seeming to believe that the high energy prices of last year were an aberration.

Summary: A misleading housing starts headline, mixed regional manufacturing reports, and an increase in prices that will be reversed next month were all eclipsed in significance by a remarkable rise in consumer sentiment last week. Following on the heels of the prior week's surprisingly strong retail sales report, it seems that the consumer is in sharp disagreement with those who continue to be bearish on the economy in general and housing in particular.

Most people don't pay close attention to business news and as a result, comforting headlines like last week's report on housing starts have clearly contributed to an improved outlook.
With the exception of shortages in certain fields, there is no stress in the job market and when considering that most homeowners have no idea if and how the value of their home is changing, as long as energy prices remain low this optimism is likely to persist for some time supporting the consumption that drives the U.S. economy.

The Week Ahead

Economic news in the week ahead will be highlighted by more data on the housing market - existing home sales on Thursday and new home sales on Friday. Other reports include the Conference Board's leading economic indicators on Monday and durable goods orders on Friday.

[Note: This is one small part of the Weekend Update published at the companion investment website Iacono Research. Since it contains no investment-specific information, it will appear here on Saturdays on a fairly regular basis. To have a look at the complete Weekend Update, including the model portfolio and much more, sign up for a no-obligation free trial today.]

All charts courtesy of Northern Trust.

Read more...

Another Good Friday

Friday, January 19, 2007

For some reason, precious metals have been going a bit crazy on Fridays since the beginning of the year. On January 5th gold fell $20, then last Friday it rose $14, and today it was up a respectable $8.

It's shaping up to be an interesting year - at least one day a week.

Just a reminder that the special subscription rate at Iacono Research expires tomorrow. After a wild first week that saw the model portfolio drop 4.2 percent, the last two weeks have showed steady strength increasing 1.2 and 0.9 percent. That's the way it usually works with commodities and related shares - quick and brutal selloffs followed by gradual rebuilding.

If oil prices are ready to head back up, the rebuilding is sure to accelerate. We'll see.

Now that cold weather has returned to much of the northern hemisphere, it looks like oil prices might stabilize at just over $50. Then again, the price may go down to $40 next week - or $60.
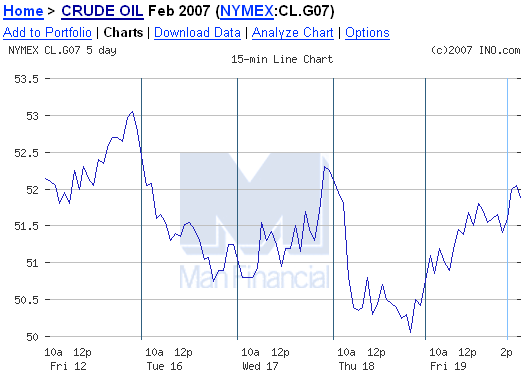
The oil companies did well. They can still make pretty good money with $52 oil - the new Congress, however, that's a completely different challenge.
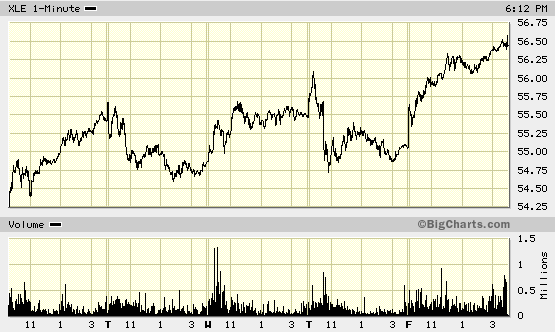
What happened on Wednesday?

Was that the producer prices report that started that $10 rise?
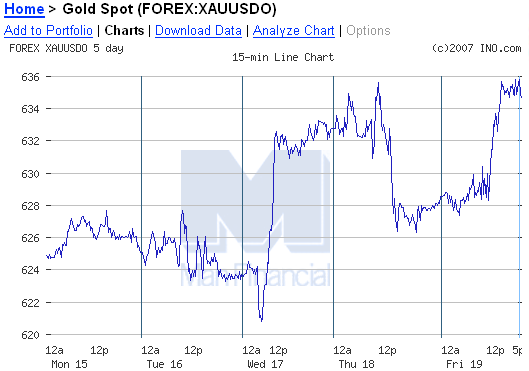
The gold miners continue to struggle.
And the dollar looks like an EKG this week.

If the Bank of Japan keeps doing stupid things like they did earlier this week by giving the appearance that their monetary policy is formulated by politicians, the greenback could get a lot stronger vs. the Yen, the second largest component in the U.S. Dollar Index behind the Euro.
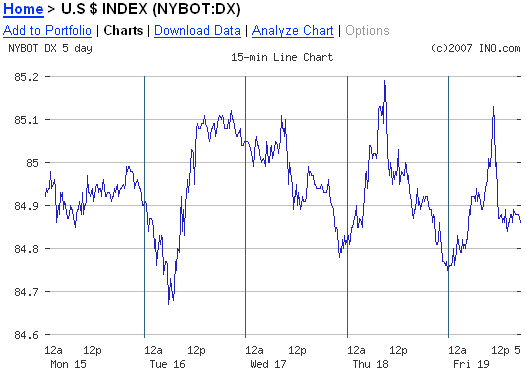
So far this year it's been one brutal sell off and two weeks of steady gains - 49 weeks to go.

Read more...

Two Views of "True" Inflation

Yesterday's testimony and Q&A session with Fed Chairman Ben Bernanke before the Senate Budget Committee had a couple of interesting moments to go along with much of the same sort of prattle that was the norm during Alan Greenspan's tenure.

The Chairman of the Federal Reserve telling Congress to rein in the budget deficit and fix entitlements seems like it's been playing on a continuous loop for the last ten years.

One thing that was different this time was that Chairman Kent Conrad (D-North Dakota) made a point early on about distinguishing between the budget deficit and the increase in debt. It seems that the great strides made recently in cutting the budget deficit in half, down to $248 billion, were all a bit of a ruse since the total increase in debt over the same period was $546 billion.
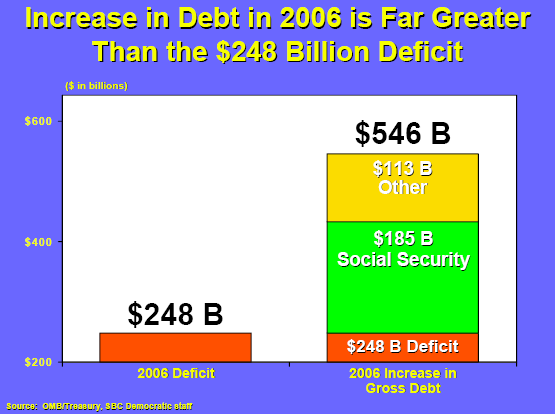
Congressional hearings have a whole different feel now that the Democrats hold the gavels. For the last ten years the first 20 minutes of a session such as this would have been consumed by eight or ten elected officials heaping praise on Alan Greenspan for the fine work he was doing.

Now, all they seem to want from Ben Bernanke is help in solving the massive long-term financial problems facing the government and its citizens.

Alan Greenspan had it pretty good.

"True" Inflation

By far the best part of the Q&A session had to do with measuring inflation.

In an insight to how the current Fed Chairman views the world of money and prices, he spoke about what he called "true" inflation, or, as Merriam-Webster might put it, the measure of inflation that is "in accordance with the actual state of affairs" or "conformable to an essential reality".

Sen. Wayne Allard (R-Colorado): The Bureau of Labor Statistics has recently introduced a new price index, it's called the "chained CPI". I wonder if you'd elaborate on that - they're claiming that it's more accurate than the current CPI. I would like to hear your feelings on that new measurement.

Ben Bernanke: Yes I think it is somewhat more accurate. The existing CPI, the one we're all familar with, takes a fixed basket of goods and values the change in the cost of that basket from month to month and from year to year. The problem with that is that it doesn't take into account that as prices change, people will change the goods and services that they choose - if oranges become more expensive, I might eat more apples.

The chain weighted CPI allows, to some extent, for adjustments that people make to go from higher price goods to lower price goods, and therefore is probably a better measure of the true cost of living increase than the standard CPI.

Allard: Do you think that the procedure that we're using now at the CBO and the OMB, that those projections overstate inflation?

Bernanke: Well, presumably the projections they're making are in terms of what they think the standard CPI inflation will be. At the Federal Reserve we've done numerous studies of these indices and we do think that the standard CPI does overstate "true" inflation, if we could measure "true" inflation, by some amount between a half and one percentage point.

Allard: Do you think we could go to those agencies and change CPI to get a better result?

Bernanke: Well, the operational question that we might ask is whether we should use the chained CPI or some other measure to index entitlement benefits or index the tax code. In congress, if your objective is to tie benefits payments and the tax code to what I would call "true" inflation, you would have a more accurate measure of "true" inflation by using the chained CPI or some alternative measure.
So, given last year's overall inflation of 2.6 percent, "true" inflation - the measure of price increases that are "in accordance with the actual state of affairs" or "conformable to an essential reality" - would be just below two percent.

An Alternative Essential Reality

The definition of "true" inflation for Ben Bernanke stands in stark contrast and will comes as a great surprise to Jim in Washington who wrote in response to Tuesday's post, Seniors in Debt. Jim has granted permission to share some of his thoughts:
I am a disabled veteran, I am no where near being elderly at 49, yet I am on a fixed income just as the retirees are. My veteran disability check is $2,314 per month, and that is not (income) taxable, I also get full medical and dental with no cost to me.

When this payment began in February 2005 I was able to get by relatively comfortably, I would not say it was middle class because I could not afford to buy a home (my first prerequisite for entrance to the middle class is enough money to AFFORD a home which eats no more than 33% of gross income for PITI), I was in California and that was simply not even close to enough income to buy even the cheapest house on the market. So, not middle class but close for one doomed to rent the for next 30 years.

Twenty four months later I can tell you that prices have so far outstripped these puny COLA raises the congress has granted that I am now actually considering going homeless, at least for the four months of the year when weather is warmer.
The new improved "chained CPI" may capture this substitution effect.
This year was a classical example, the congress initially announced a 4.1% COLA for retirees and veteran's , but the GOP on the hill said that was too much and they got their way in one of their last acts before getting curbed by the democrats in the elections. They trimmed the COLA to just 3.3%, that was in a year when my landlord raised rents from $700 to $800, some 15% for the renewal on the lease. Rents are up even more since. Food is getting to be a problem, and I have had to resort to the food bank more than once.
...
My living standard has not just noticeably dropped it has plummeted. I am scrambling to pay off my only credit card with a balance of some $2,500 because I cannot afford the interest and fees. Mind you I am one of the LUCKY ones, my income is far higher than most on social security or other disabled veterans even. It seems every month I have to find something else to cut out, and every month I find prices spiking all around me, a haircut went up from $12 to $15, a car wash at the automatic place went from $5 to $6.
...
This is the reality for fixed income people, the federal government is blaming retirees and disabled people for their budget problems, Bernanke said it today, if they do not CUT entitlements the USA will be bankrupt.

This is a gross violation of the social contract by which the USA was able to build a thriving middle class in the first place, and I am not alone when I say that the middle class is the goose that laid the golden eggs that the rich so enjoy. Their greed is so boundless that they do not care if old folks die or veterans live out of dumpsters.

They WILL care however when these millions come and haul them into the town square for a lynching. So, they will hire some of the poor to be in their private armies and we will have taken the last steps to feudalism again.
Economists really do need to occasionally pull their noses away from reports and computer screens full of statistics and get out more.

Apparently, "truth" is all a matter of perspective.

Read more...

The Fed on Asset Bubbles - Part 63

Thursday, January 18, 2007

Preventive medicine may be popular with doctors, but if you're an economist at the Fed, there appears to be no corollary to taking action in an attempt to prevent something bad from happening - at least not when it comes to asset bubbles.

In one more speech by one more Federal Reserve economist on the subject of asset bubbles, we are all reminded that the Fed can not detect an asset bubble in real time.

And even if they could, it is far from certain that they could do anything about it.

In this speech by Frederic S. Mishkin, the newest member of the Fed's Board of Governors, it is explained one more time.

Over the past ten years, we have seen extraordinary run-ups in house prices. From 1996 to the present, nominal house prices in the United States have doubled, rising at a 7-1/4 percent annual rate. Over the past five years, the rise even accelerated to an annual average increase of 8-3/4 percent. This phenomenon has not been restricted to the United States but has occurred around the world. For example, Australia, Denmark, France, Ireland, New Zealand, Spain, Sweden, and the United Kingdom have had even higher rates of house price appreciation in recent years.

Although increases in house price have recently moderated in some countries, they still are very high relative to rents. Furthermore, with the exception of Germany and Japan, the ratios of house prices to disposable income in many countries are greater than what would have been predicted on the basis of their trends. Because prices of homes, like other asset prices, are inherently forward looking, it is extremely hard to say whether they are above their fundamental value. Nevertheless, when asset prices increase explosively, concern always arises that a bubble may be developing and that its bursting might lead to a sharp fall in prices that could severely damage the economy.
...
Because central banks are in the business of managing total demand in the economy so as to produce desirable outcomes on inflation and employment, monetary policy should accordingly respond to home prices to the extent that these prices are influencing aggregate demand and resource utilization. The issue of how central banks should respond to house price movements is therefore not whether they should respond at all. Rather, the issue is whether they should respond over and above the response called for in terms of objectives to stabilize inflation and employment over the usual policy time horizon. The issue here is the same one that applies to how central banks should respond to potential bubbles in asset prices in general: Because subsequent collapses of these asset prices might be highly damaging to the economy, as they were in Japan in the 1990s, should the monetary authority try to prick, or at least slow the growth of, developing bubbles?

I view the answer as no.
Of course not.

The entire world economy is predicated on asset prices rising faster than debt - that's how wealth is created these days. And since prices for stocks and real estate don't show up in any of the inflation statistics, in theory, asset prices can (and probably will) go much higher.

Besides, it's no fun being a wet blanket. If you want to be a rock star at the Fed, you can't be a wet blanket.
A special role for asset prices in the conduct of monetary policy requires three key assumptions. First, one must assume that a central bank can identify a bubble in progress. I find this assumption highly dubious because it is hard to believe that the central bank has such an informational advantage over private markets. Indeed, the view that government officials know better than the markets has been proved wrong over and over again. If the central bank has no informational advantage, and if it knows that a bubble has developed, the market will know this too, and the bubble will burst. Thus, any bubble that could be identified with certainty by the central bank would be unlikely ever to develop much further.

A second assumption needed to justify a special role for asset prices is that monetary policy cannot appropriately deal with the consequences of a burst bubble, and so preemptive actions against a bubble are needed. Asset price crashes can sometimes lead to severe episodes of financial instability, with the most recent notable example among industrial countries being that of Japan. In principal, in the event of such a crash, monetary policy might become less effective in restoring the economy's health. Yet there are several reasons to believe that this concern about burst bubbles may be overstated.
...
Many have learned the wrong lesson from the Japanese experience. The problem in Japan was not so much the bursting of the bubble but rather the policies that followed. The problems in Japan's banking sector were not resolved, so they continued to get worse well after the bubble had burst. In addition, with the benefit of hindsight, it seems clear that the Bank of Japan did not ease monetary policy sufficiently or rapidly enough in the aftermath of the crisis.
...
A third assumption needed to justify a special focus on asset prices in the conduct of monetary policy is that a central bank actually knows the appropriate monetary policy to deflate a bubble. The effect of interest rates on asset price bubbles is highly uncertain. Although some theoretical models suggest that raising interest rates can diminish the acceleration of asset prices, others suggest that raising interest rates may cause a bubble to burst more severely, thus doing even more damage to the economy. An illustration of the difficulty of knowing the appropriate response to a possible bubble was provided when the Federal Reserve tightened monetary policy before the October 1929 stock market crash because of its concerns about a possible stock market bubble. With hindsight, economists have viewed this monetary policy tightening as a mistake.
Clearly, there are far too many assumptions necessary to even begin to think about targeting asset prices through interest rate policy.

To some degree this makes a lot of sense.

Low interest rates in and of themselves are not necessarily a bad thing - it's when low rates are combined with an abject failure in controlling credit creation and regulating the mortgage lending industry that bad things tend to happen.

Read more...

Peak Oil in Three Charts

For those of you with an interest in the world's most important commodity, if you haven't already done so, stop by The Oil Drum for some of the best information, analysis, and discussion on the topic of "Peak Oil".

This is a subject about which most Americans are blissfully unaware.

That feeling has only been enhanced by the precipitous decline in crude oil prices in recent months, from the uncomfortable highs near $80 to what now seems like bargain basement prices near $50.

The expense of filling up an SUV will soon be back down at comfortable levels and all will seem right in the world of energy - at least for a while.

How long a while?

That's what the peak oil debate is all about.

Google the phrase Peak Oil and you'll get Matt Savinar's Life after the Oil Crash at the top of the list. Given what appears on the main page, a casual passer-by could easily come away with the impression that peak oil means that the end of the world is at hand, quickly dismiss the whole idea, and then quickly move on.
If the end of civilization as we know it really is at hand, it's not clear how you would convey that to others without sounding alarmist - it seems that's part of the problem with the Peak Oil discussion.

It's kind of like calling a stock market bubble a bubble, or calling a housing bubble a bubble. No one wants to be told that the good times are coming to an end - that there really are no free lunches (or, in this case, that there really isn't an endless supply of cheap oil).

Being a mere novice on the subject in comparison to the staff at The Oil Drum, all that is being attempted here today is to show a few charts on the topic to perhaps add a bit of clarity to the picture - to "dumb it down" for those without a PhD.

Three charts should do the trick.

The first chart is from the International Energy Outlook 2006 report from the International Energy Administration (IEA) and shows projected world oil consumption going out a few decades.

Pretty straightforward stuff - the update for 2007 will be out this summer and this data from last summer may have been revised since it was released, but it's good enough for use here today.
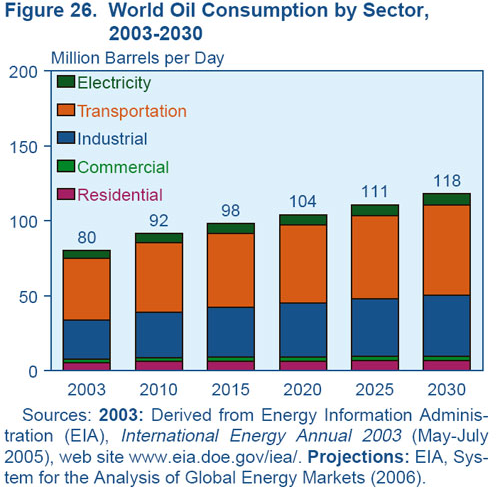
The second chart is from the January 2007 Peak Oil Update by Khebab at The Oil Drum, posted earlier this week.

Again this is pretty straightforward stuff.

What you see below is the current world oil production of about 85 million barrels per day - a production level that can be matched up with what one could reasonably extrapolate from the chart above.

The current demand is something less than the current production of about 85 million barrels per day - whether it is two million less or four million less is a discussion best left to others.
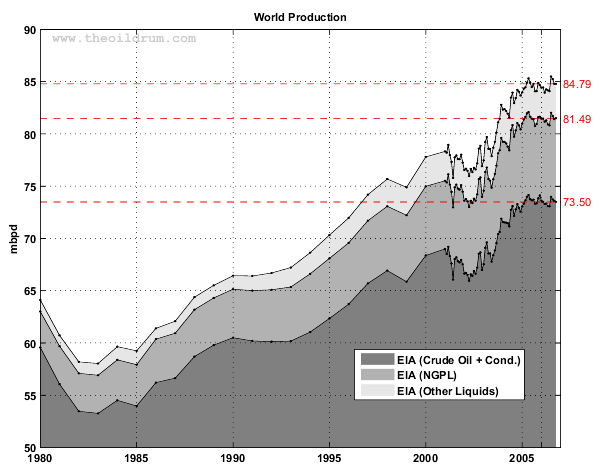
Chart number three below (also from Khebab at TOD) is where things get complicated.

The debate regarding the demand for oil in the future pales in comparison to the debate about its supply in the years ahead, as clearly indicated by the multi-colored lines in the chart below, each one showing a different rate of production over time.
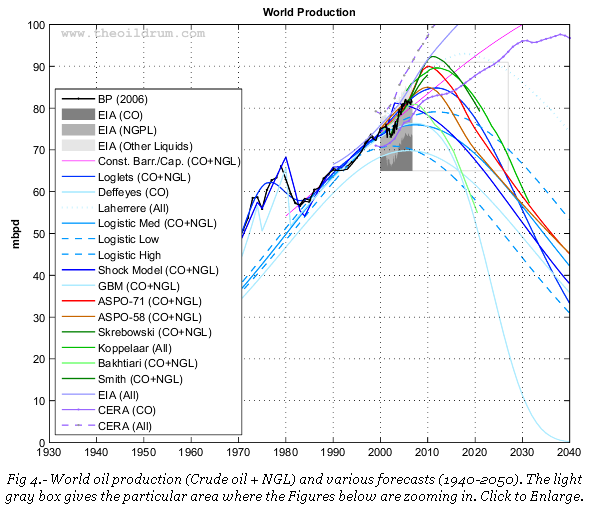
Which line will prove to be the correct one? Who knows.

Only one of the lines intersects the year 2010 at a level above the expected demand of 92 million barrels per day. That's the outlook being offered by the uber-optimistic CERA (Cambridge Energy Research Associates), an organization whose motives many have questioned.

That could be a problem.

Read more...

Model Portfolio Performance

Wednesday, January 17, 2007

During lunch today I did a radio interview about yesterday's post Seniors in Debt, a story (about a story, as it were) that quickly made it onto Seeking Alpha and Yahoo! Finance. I've never heard myself on the radio before - I'm afraid it's going to sound all nasally and maybe even a little whiney.

If it's any good I'll post a link to the radio program's archive page where it will be available as a podcast.

We'll see.

In the meantime, readers are reminded that we are in the middle of a promotion this week for the companion investment website Iacono Research, which I was able to plug in a ham-handed sort of way during the interview.

There is much to learn here about self promotion.

Last year's introductory rate for a one-year subscription is available through the end of the week only at the following link:


This rate is not likely to be brought back for at least a few months, maybe never again. It is intended for those of you who might want to expand your investment portfolio in the new year now that energy commodities and related shares are on sale.

Energy, metals, and other commodities along with shares of related companies and foreign currencies all go into the model portfolio which gained 25.4 percent in 2006. It's off to a rocky start in the first two weeks of the new year, but this also means that buying opportunities abound.

The chart below shows the performance of the model portfolio alongside the
S&P500 over the last two years. For those of you invested in only stocks and bonds, note the low correlation to broad equity markets, something that may come in handy this year if equities falter.
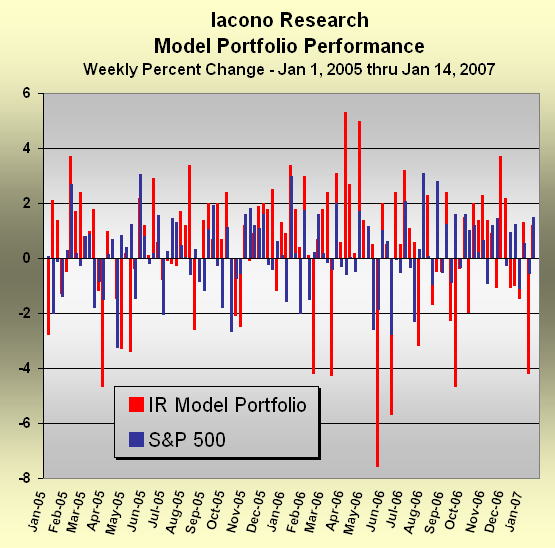
Also note the increased volatility - this takes a little while to get used to, but it's worth it.

As represented by the relative magnitude of the red and blue bars above, there is almost a two-to-one difference in volatility between the model portfolio and the S&P500.

During 2005 and 2006, the S&P500 had 45 down-weeks with an average loss of 1.06 percent along with 59 up-weeks with an average gain of 1.09 percent.

During the same period, the model portfolio had 36 down-weeks with an average loss of 2.02 percent along with 68 up-weeks with an average gain of 1.72 percent.

The cumulative gain for the S&P500 for 2005 and 2006 was 17.4 percent and for the model portfolio gains totaled 46.3 percent.

On an annual basis this breaks down as an increase of 3.7 percent in 2005 and 13.9 percent in 2006 for the S&P 500 versus gains of 20.7 percent in 2005 and 25.4 percent in 2006 for the model portfolio.

Is it time to add some hard assets to your investment mix in 2007?

Everyone should at least own a little gold - even Money Magazine thinks so.

If you'd just like to have a look around at the website with no obligation to purchase a subscription, click here to start a two-week free trial and you'll still be eligible for the special rate at the end of your trial period.

Read more...

DataQuick on Housing

DataQuick reported December real estate sales data for Southern California yesterday. It was pretty much the same story that has been told here for the last year or so - while sales volume continues to plunge, prices continue to flatten out right around the half million dollar mark.

A half million dollars for an average home...

After a few years, it all seems so normal now - a $300,000 home is what poor people live in, to get something nice you have to spend at least twice that amount, and million dollar homes?

Not really a big deal anymore.

There are lots of million dollar homes in Orange and Ventura Counties. Prices ticked up there last month as the well heeled closed on new digs just in time for the holidays.

Click to enlarge

Home prices in San Bernardino County reversed course after last month's bounce. Having passed through there recently on a trip to Arizona, it sure seems that average prices in the $375,000 range are way too high - in the chart above, that's the only county that has doubled in price over the last four years.

In the chart below showing the year-over-year change in price, San Bernardino County had the steepest downward slope up until the interruption last month. A betting man might say that it will be next to dive below zero.

Click to enlarge

San Diego County takes over from Ventura County as the biggest loser at 6.4 percent below year ago prices. Ventura County, from where this blog originates, may not like being in second place for long - for sale signs are popping up all over the place and sellers are motivated (a word stronger than "motivated" may apply in a couple months - inventory is very high around here for January).

Last month's sales volume in the chart below was the lowest since December 1995 - that was not a very good year, unless you were a buyer. Back then you could have bought an above average home for less than $250,000. That same home would have sold for about $750,00 last year. Who knows what it will fetch in 2007 - pricing is in the hands of buyers and will remain that way for some time to come.

Click to enlarge

The next two reporting periods, for sales closing in January and February, are historically the slowest months of the year due to buyers and sellers being otherwise occupied during the holiday season. The chart above may become severely distorted as a result.

And prices? Who knows.

The real test will come in the March data that gets reported in April - the combination of high inventory, growing awareness of the housing slump, motivated sellers, and fewer sub prime lenders may pressure prices in a way that surprises a lot of people.

DataQuick President Marshall ("almost all, if not all, of those gains are here to stay") Prentice doesn't seem to be too concerned about home prices. In the most recent report, he commented:
In any real estate cycle, when prices peak, they don't level off at that peak, they come down some. The question is, how much? We need to remember that prices have gone up 100 percent in Southern California the last four years. Most of that increase is here to stay.
It's clear that the "if not all" assurance from the price peak of November 2005 is now off the table - now it's a question of the meaning of the word "most".

Read more...

BusinessWeek on Housing

Tuesday, January 16, 2007

Though their cartoon drawing leaves something to be desired, BusinessWeek seems to be on top of things when it comes to the housing market - they have been one of the more objective voices on this subject from within the ranks of the mainstream media in recent months.

The current print edition had this short piece by Mara Der Hovanesian about the bottom in the housing market now being called regularly by the National Association of Realtors and many economists, including none other than Alan Greenspan.

BOOM AND BUST
About That Short Housing Slump…

Has housing hit bottom? Not if history is any guide, says Hugh Moore, a partner at Guerite Advisors, a money manager in Greenville, S.C. Using data from the seven previous housing cycles since 1959, Moore concludes that the sector will fall further—and land hard. Take housing starts. In the past, they fell an average 51% from peak to trough. So the current downturn, with housing starts off about 30% from the January, 2006, peak has further to go. And it may meet recession on the way. That's because in six of the seven cycles, when starts fell more than 25% from their most recent peaks, the economy tanked.

Another gloomy stat: In the same seven cycles, the amount people spent on new housing as a percent of gross domestic product fell an average 28% from market peak to trough. Worse, in six cycles, recession kicked in when the ratio fell more than 10% from its most recent peak. In this slump, Moore says, that ratio has fallen 10.5% from its fourth-quarter peak.

History also shows housing corrections take an average 27 months. Thus, the current doldrums may linger a year or more. "It's just going to be this slow, grinding drain on the economy," says Moore, who adds that month-to-month housing stats producing relief rallies are "just noise."
Peter Coy then weighed in with this story about re-listing properties that sit too long on the Multiple Listing Service.
New Listing! (Sort Of)
Agents are pulling houses off the market and then presenting them as new offerings

Real estate agent Ross Simone wasn't attracting any potential buyers for a house in Mechanicsville, Md., that had sat on the market for months, so last November he took action. He pulled the house out of the regional database of active listings and then immediately reinserted it, changing the property ID number used to track properties over time. The result: The house appeared to be hitting the market for the first time. "It's in the best interests of my client [the seller]," Simone said in a November interview. "I started doing it consistently this year. I do it as much as I can."

With open houses as quiet as death lately in many parts of the country, sellers' agents are trying everything they can to make a sale, including sometimes tweaking the computerized data that potential buyers depend on. Fresh listings attract attention and can fetch higher prices because buyers are less likely to make lowball offers.

Real estate is largely self-regulated. In most of the U.S., agents are responsible for entering information about the homes they're selling into a database that is maintained by the local Multiple Listing Service. Each of the 900-plus MLSs sets its own rules. The trick of making old listings appear new is against the rules of Simone's MLS, although he said later that he didn't know it at the time.
The days of self-regulation in the real estate industry are probably numbered.

Whether it's a long slow leak or a real popping sound, the nation's housing market is in for a painful adjustment to get home prices back in line with fundamentals such as incomes and rents (yes, fundamentals will again matter - just ask the mortgage lenders today).

Realtors will not likely provide much help during the adjustment process.

Read more...

Seniors in Debt

Recent stories about the plight of seniors bring to light the growing problem of money not stretching as far as it once did. Today, the elderly are in the unfortunate situation where they benefit very little from cheap imported goods manufactured in Asia - the key to what some call an "era of low inflation".

Their money is increasingly spent on life's essentials - food, utilities, and medical costs - all of which have risen at a brisk pace in recent years. In many cases, the combination of a pension and a paid off home has been replaced by a meager retirement income, high bills, and a reverse mortgage.

A decade ago, homes were routinely passed on free and clear to surviving children, ten years from now heirs may be surprised to find out how little is left after years of borrowing by their parents to make ends meet.

According to this report from the U.K., inflation is now running at almost 10 percent for pensioners. With interest rates rising, those on fixed incomes who must access credit to square the books each month find themselves getting further and further behind.

~~~~~~~~~~~~~~~~~~~~~~~~~~~~Advertisement~~~~~~~~~~~~~~~~~~~~~~~~~~~

Start taking steps toward a more secure retirement now - learn how to protect yourself from the ravages of inflation at Iacono Research.

The Introductory Rate is Back for a Limited Time

Through the end of the week, the introductory rate is once again available - only $99 for a full year of weekly updates including market commentary and investment selections. If you'd like to have a look around, click here to start a two-week free trial and you'll still be eligible for the special rate at the end of your trial period.

~~~~~~~~~~~~~~~~~~~~~~~~~~~~~~~~~~~~~~~~~~~~~~~~~~~~~~~~~~~~~~~~~

Stateside, an increasing number of senior citizens are turning to reverse mortgages and credit cards to make ends meet. It didn't used to be this way and it flies in the face of government pronouncements that inflation is under control.

For decades, social security and pensions provided a stable income in retirement. That is still mostly true today, the problem is that living expenses are rising much more quickly than income as demonstrated a year ago when the average monthly social security increase was about $35 while Medicare premiums increased $28.

In this report from Texas, we learn first hand what it is like for some:
When Miss Daisy, 65, totals her monthly bills they amount to usually $200 more than her income. She relies on credit cards to bridge the difference. 'I have no savings, so I have no choice,' she said.

When she adds up her monthly bills for her mortgage, car loan, electricity, gas, water and phone, they exceed her income from Social Security and a part-time job by almost $200.

"I rely on my credit cards to make ends meet," said the 65-year-old Dallas woman, who asked that her last name not be used. "I have no savings, so I have no choice."

She owes more than $7,000 on three cards.

Seniors who grew up in frugal times and have usually been reluctant to go too far into debt are turning increasingly to credit cards to make do in retirement, says a study by the National Consumer Law Center.

"Older people have generally held less credit card debt than younger consumers, but their generation is catching up," said Deanne Loonin, the principal author of the report by the Boston-based consumer advocacy group.

The study quantifies a trend that credit counselors have seen recently. It found that the average credit card debt for consumers 65 to 69 skyrocketed 217 percent over the last decade to $5,844. Researchers calculated the inflation-adjusted increase by examining Federal Reserve data on the assets and liabilities of American families.

The consumer advocacy group's report blames the trend on a combination of seniors' shrinking or stagnating incomes, higher expenses for housing, medical care and utilities, and creditor practices that push seniors to borrow.

"It's not just that elders have more debt than before, but that many are buried in unaffordable debt," Ms. Loonin said.
It's a sort of long, slow squeeze for most seniors and it must be particularly hard for those who have eschewed credit and debt for most of their lives to be forced to rely on it now.

Ask retirees what they think of lower prices for iPods and PCs and the low inflation rate of only two percent - you are likely to get an earful.

Unfortunately, things are probably going to get worse as baby boomers enter their golden years - an entire generation has been conditioned to accept high debt loads in exchange for rising asset prices. In the end, this may not prove to be a very good long term plan.
A 2004 study by Demos, a New York-based research institute, found that consumers within 10 years of retirement are spending an average of one-third of their income on debt payments.

That's partly because some had children later in life and are paying for their youngsters' college education into their late 50s and early 60s. Others have become caretakers for frail parents. Still others have simply spent too much.

"For a variety of reasons, boomers won't have the nest eggs they'd like, and they won't have the pensions and health care benefits that many of today's retirees enjoy," Ms. Cobb said. "Things will only get worse."
It looks like the baby boomers are going to get a retirement wake-up call in coming years.

It didn't have to be this way.

Read more...

Buttonwood on Oil

Monday, January 15, 2007

This Buttonwood column($) from the current issue of The Economist is about as mainstream as you can get when it comes to oil prices. Like most others in the financial world, this anonymous economist sees the commodity price action of the last few years as an aberration - much ado about nothing.

WHAT a difference a year makes. When Russia cut off gas supplies to Ukraine in January 2006, crude prices jumped 19% within a few weeks. This year, a similar halt to supplies, because of an oil dispute with Belarus, was a one-hour wonder in the market. The crude price slipped close to an 18-month low on January 9th.

Oil has not been rescued by planned production cuts by the Organisation of the Petroleum Exporting Countries nor by speculation about an American or Israeli attack on Iran, both stories that would normally add several dollars to a barrel.

Some attribute oil's fall to the mild winter in the northern hemisphere, which saw New Yorkers sunbathe in early January. But copper has also been plunging in price, which cannot be blamed on the weather. Other metals have been dragged down in copper's wake. The Economist All-items commodities index, which excludes oil, fell 10.2% in the week to January 9th (see chart).

It is possible that falling commodity prices are signalling a rough patch ahead for the world economy. Perhaps they are catching up with the mood in the bond markets, where the inverted yield curve (in which short rates are higher than long rates) has, many believe, for months been pointing to a slowdown.

But the gloom thesis is not really borne out by recent economic data, which have shown, for example, strong American employment gains and buoyant German manufacturing. Nor are there other signs that investors are becoming depressed about the outlook for global growth. The Baltic freight index, a measure of trade flows, has more than doubled within the past year (also see chart).

It seems more likely that commodity prices are being driven down by two other factors. The first is supply, as higher prices have steadily led to increased production. Dresdner Kleinwort, a German bank, reckons that 2007 could be the first year in the current “super-cycle” in which the supply problems in a range of metals will start to subside. Meanwhile, users of oil have piled up inventories (although the most recent data showed a dip), leaving them less vulnerable to supply disruptions.
Commodity markets are now turning into something like that game "Whack-a-Mole" - oil goes down then corn and wheat go up, copper goes down then nickel goes up. The production and consumption figures seem to change so quickly it's hard to make sense of any of it, but ever-optimistic economists are sure that an ever-increasing supply will tamp down prices - that's the way it's always worked.

And investors who have shunned paper assets in favor of hard assets have made the problem much worse - why can't everyone be happy with paper assets?
The second force is the flow of investment. It is surely no coincidence that the two commodities to suffer most in the recent sell-off are oil, the most-traded commodity, and copper, where speculative excess seemed greatest.

The enthusiasm for commodities in recent years has been part of a general move into “alternative assets”, a term that covers everything apart from shares, bonds and cash. The idea was to find assets that were uncorrelated with traditional holdings, a move that should improve the risk-reward trade-off of portfolios.

When such a fashion takes hold, it can rapidly gain momentum. This is because alternative-asset classes are often small and new investment flows drive prices up very quickly. To those participating in the trend, that confirms the wisdom of their original decision and encourages others to jump aboard.

With commodities, institutional investors often bought index portfolios, which meant putting money into raw materials, regardless of the fundamentals of each market. (One problem for copper is that its index weighting, along with that of other base metals, is being reduced.)

Oil is the biggest single component in most commodity indices. Citigroup estimates that, from 2003 onwards, financial flows had pushed up the price of oil by some $35 per barrel.
Well, that's the kind of number you like to see next to the word "oil".

Eventually Steve Forbes will be right - he's been wrong for two years now, but eventually the price of oil will go to $35. None of us may be alive, but eventually he'll be right.

No mention of gold in this report. The metal has been hanging around over the $600 mark for what must be an uncomfortably long time - for an economist.

Read more...

The Asset Shufflers

Anyone who read the roundtable discussion at Barron's ($) over the weekend and who is now reading this blog should not be surprised that Dr. Marc Faber is prominently featured in the recap that appears below.

It was a pretty funny bunch that also included Bill Gross of Pimco and ten others, many with names that are unfamiliar here. Some of them will not be easily forgotten such as Art Samberg, apparently the head asset shuffler in the bunch, for his memorable response when asked to comment on the year just concluded and the prospects for 2007.

Art Samberg: If it ain't broke, don't fix it. China is growing by 9%, 10%. India is growing slightly less. Brazil is growing at a nice rate. I don't see where there's anything all that unusual.We have no inflation in the world. These countries are sucking up commodities, providing low-cost labor. Productivity is slowing but it is still decent. There's no major change in anything. The world economy is growing faster than anything we've ever seen before. In the long term, will jobs get outsourced and the U.S. lose its dominant position? Perhaps. It's a risk. But it ain't going to happen this year. As for housing, price inflation in the United States is no different from what it was in England and Australia, and those markets didn't see a collapse.

Felix Zulauf: There's a difference, Art. The U.K. and Australian housing markets never had an inventory problem. Prices turned flat for 12 months, but inventories didn't go up.

Mario Gabelli: Housing has had a typical cycle, with some excesses.

Bill Gross: Excesses like we've never seen before. Home prices on a year-over-year basis are down 3.1%, according to the National Association of Realtors. We've never had a year-over-year decrease of this magnitude on a nominal basis

Samberg: A 3% decline is something to worry about, but it doesn't change how the consumer thinks his balance sheet looks.
That pretty much summarizes the whole discussion - a large group of asset shufflers who plan to make as much hay as they can while the sun still shines, and a smaller coterie of realists who fear that something will eventually go terribly wrong.

A consumption based economy driven by rising asset prices where most of the asset owners do not yet know how much "wealth" they've lost in the last year due to falling home prices. What could possibly go wrong?
Moderator: You've been quiet, Marc. What's wrong?

Marc Faber: I agree with Art that we are in the midst of the greatest synchronized economic expansion in the world. In the first 150 years of capitalism, the colonial system prevailed. It was never the objective of the industrialized countries to boost growth rates in the colonies. They were used for exploitation. Once the colonial system broke down, roughly three billion people fell under communism and socialism. After 1980 commodity prices collapsed and Latin America went into a depression. Then the Soviet Union collapsed. While Latin America began to recover in the 1990s, Japan, at that time the second-largest economy in the world, had stopped growing. The Asian crisis hit in '97, the Russian crisis in '98. So there was no synchronized growth.

The recovery began in November 2001 in the U.S. Strong consumption growth in the U.S. boosted industrial production, notably in China. Incremental industrial growth, combined with strong personal-income gains and capital spending, then led China to import resources, in particular oil. That led to rising commodities prices, which greased the economies of the Middle East and the former Soviet Union. Demand from China for copper and iron ore greased Latin America and Australia, and those countries grew rapidly. They demanded more imported goods, capital goods and luxury goods from Europe and Japan, and bingo! You suddenly had the whole world expanding rapidly. However...

Moderator: We knew that was coming.

Faber: Global imbalances have increased. The emerging world has grown much more rapidly than the United States. In the U.S., ultra-expansionary monetary policy got under way ahead of Y2K in 1999. It continued after 2001, when the Fed slashed interest rates to 1% from 6.5%. Though the Fed has raised rates since 2004, to 5.25%, we still have expansionary monetary policies worldwide. If you define economic growth by consumption, the U.S. has grown rapidly and will probably continue to grow. If you print money you give people the opportunity to spend. But along with the spending came a growing trade and current-account deficit, which was offset by surpluses in Asia. Every region of the world has a current-account surplus with the U.S. For the first time in capitalism, the poor countries, notably China, are financing consumption in the U.S. This will not last forever.

In 2006 -- hurrah, hurrah -- the Dow Jones Industrial Average was up 16% and the S&P 500 14%. But in euro terms the S&P was up less than 5%. In gold terms it was down. Against most commodities, the Dow was down. The U.S. also has a split economy. The typical household is not doing well. But one economy is doing exceedingly well: the asset shufflers in this room. [Nervous laughter] This economy is in the greatest bubble ever. There's a bubble in the art market; art prices were up 27% last year. There's a bubble in equities, especially in emerging markets, and in real estate in Anglo-Saxon countries. The big threat is not that liquidity will vanish because of Federal Reserve action. The Fed will print money, I guarantee you. But when asset markets go up, they create liquidity by allowing people to borrow more money against appreciating assets. When asset values go down, liquidity contracts immediately because people repay loans. The moment the asset bubble begins to deflate, liquidity will contract.
Some would call Dr. Faber a wet blanket, others would call him a realist.

Art Samberg would probably call him a blanket that is so wet, cold, and heavy that it should be immediately tossed in the trash bin in favor of an exotic cashmere bed cover imported from Asia.
Samberg: Where is the bubble? I'm confused. Marc appropriately gave us a history lesson about how the world has changed to one in which economic growth and personal freedom and better lifestyles are adopted across the globe. The most mature financial markets are here in the U.S., and we're the clearinghouse for the world, which can lead to long-term problems. But why turn a positive into a negative? The world is awash with growth. It is awash with liquidity, and our markets can clear liquidity better than any others.

Moderator: It is also awash in consumption, extravagance and debt.

Faber: America's current-account deficit has greased the whole world. Latin American markets are in the midst of a huge boom. The Argentine stock market is up 10 times from the lows. Latin American debt on a total-return basis has doubled in the past five years. In Asia we have bubbles in real estate. In the U.S. there's a debt bubble. Debt is now 330% of GDP. That will prevent the Fed from ever pursuing tight monetary policies, even if it becomes necessary.

Hickey: Asset bubbles are always fun while you are going through it. The tulip bubble was fun. The Mississippi bubble was fun. But they always end in tears and disaster.

Gabelli: I'll float a bubble. Abby, the Democrats won the midterm elections in a landslide. Marc, should we worry about a politically motivated constraint on global trade?

Faber: I'm less worried about that than this: The five brokerage firms in New York -- Merrill Lynch, Morgan Stanley, Lehman Brothers, Bear Stearns and Goldman Sachs -- paid out $36 billion in 2006 bonuses. Compensation and bonuses together roughly are equal to Vietnam's GDP. I see a bipolar world in which there's the typical household in the U.S. or Western Europe, and then this huge wealth concentration. It will lead to a political backlash one day.

Moderator: Starting in Connecticut.
Yeah, that's going to be the tricky part. One day they'll storm the castle and drive the asset shufflers out into the streets and then things might get ugly.

But it ain't going to happen this year.

Read more...

Cartoon Wars

Sunday, January 14, 2007

Who's got the better cartoons, BusinessWeek or The Economist? It's really no contest as demonstrated once again this week and shown below. While the American business weekly occasionally hits a home run, usually having something to with the housing bubble, more often than not it disappoints.

Like this week.
The cartoon artists at The Economist work with fewer colors but sharper wits.
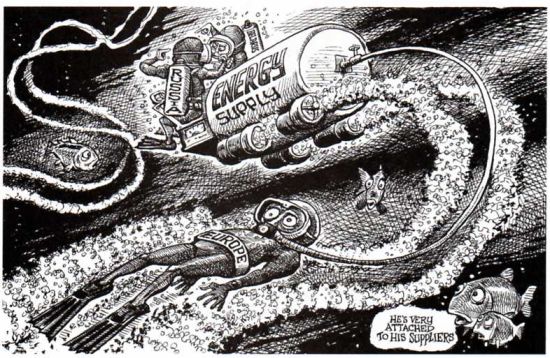
They've done a great job with tables in the back of The Economist as well, now combining economic data for emerging markets along with developed nations.

Look how well inflation is being controlled around the world - marvelous. That is except for Russia, Venezuela, and a couple others. Don't go to South Africa if you're looking for work - the unemployment queues are probably very long (yes, queues, though the British probably have a different word for unemployment).
It must be terribly tedious and boring to collect and publish this data week after week - all those asterisks and funny cross-like symbols. It's doubtful that if mistakes are made anyone notices. They could just be making up these numbers.

Well, actually, that's the government's job.

Read more...
IMAGE

  © Blogger template Newspaper by Ourblogtemplates.com 2008

Back to TOP