Wikinvest Wire

The Week's Economic Reports

Saturday, December 02, 2006

This may or may not become a regular thing - we'll see. It has long been a desire to publish something here at the blog on Saturdays, a day when attention is normally given to the companion website Iacono Research, but there just hasn't been the time.

It occurred to me that the summary of the week's economic reports, part of the Weekend Update that goes out to subscribers on Sundays, might be just the thing to solve that problem since this data is available from many other sources and not specific to any of the investment decisions at the website.

This may seem weird to regular readers because the tone of the writing at the website is very different than what appears in the blog.

Anyway, here it is.

Following is a summary of last week's economic reports. Pronounced weakness in manufacturing and construction were the most important developments for the week, adding to the mounting evidence of a slowing economy. For the week, the S&P 500 Index fell 0.3 percent to 1,397 and the yield of the 10-year U.S. Treasury note fell 12 basis points to 4.43 percent.
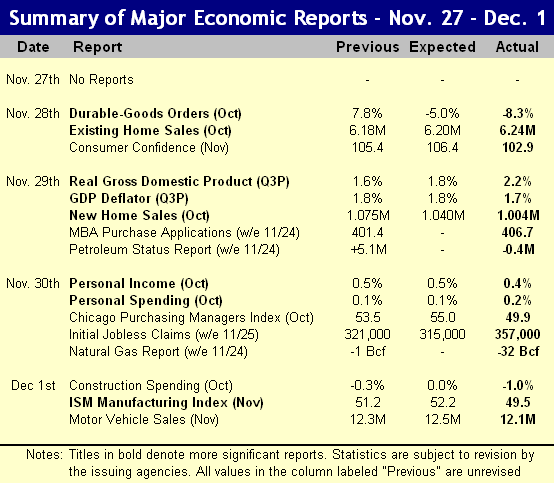
Durable Goods Orders: Orders for durable goods fell 8.3 percent in October, after an upwardly revised increase of 8.7 percent in September. Wild swings in civilian aircraft orders once again dominated the data - in September aircraft orders rose almost 200 percent while in October they fell almost 50 percent. Excluding this category, the trend is decidedly down, however, not as would be implied by the most recent report. The year-over-year change in new orders fell from 15.2 percent in September to 2.3 percent in the most recent report.

Existing Home Sales: Existing home sales rose 0.5 percent in October to an annual rate of 6.24 million after declining for the last six months. Overall, on a year-over year basis, sales are down 11.5 percent. Much of the increase is being attributed to the drop in sales prices, the natural consequence of rising inventory amid sluggish sales. Prices declined a full 3.5 percent from year ago levels, the largest drop ever recorded in this data series from the National Association of Realtors.
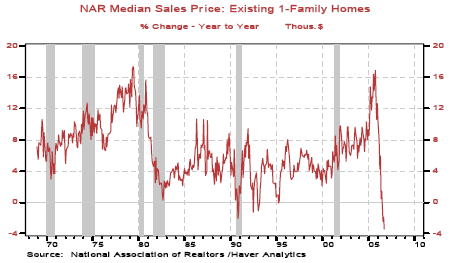
The supply of homes for sale rose slightly to 7.4 months, the highest level in 16 years, up 51 percent from year ago levels. While the sales increase from September to October was a positive sign that buyers are reentering the market, it would appear that more price cutting will be required to reduce the inventory.

Consumer Confidence: Consumer confidence came in well below expectations, the decline from 105.1 to 102.9 reflecting the end of the impact of lower price gasoline in all but the inflation expectations measure that declined from 4.9 percent to 4.7 percent. The outlook for jobs and plans to buy automobiles were both very weak.

New Home Sales: Sales of new single-family homes dropped 3.2 percent in October, coming in significantly lower than expected and the most recent data was accompanied by substantial downward revisions to the August and September data. On a year-over-year basis, new home sales are down 26 percent. Prices increased 1.9 percent from year ago levels after a year-over-year drop of 9.2 percent last month.

Recall that last month sales increased slightly along with the large drop in prices, whereas this month, prices were firm but sales volume declined. The same dynamic was seen in existing home sales released on Tuesday where a higher sales volume was accompanied by lower prices. As with existing homes, new home inventory is still very high at 7.0 months, up from 6.7 months in September, so further price cuts will be required if sales are to be increased on a continuing basis. Also remember that cancellations are at all-time highs, and these numbers do not get added back into the inventory data, creating a misleading picture of supply.

Gross Domestic Product: The second of three reports for third quarter real GDP showed economic growth at 2.2 percent annualized after an advance estimate of only 1.6 percent. This exceeded expectations of 1.8 percent. Following first and second quarter annualized increases of 5.6 percent and 2.6 percent, respectively, the year-over-year change to real GDP now stands at 3.0 percent. Business fixed investment, inventory, government purchases, and corporate profits all rose while consumption was down slightly along with another large quarterly decline for housing (residential investment). Rising inventories, one of the larger changes from last quarter is not necessarily a good thing, especially when combined with slowing consumption.
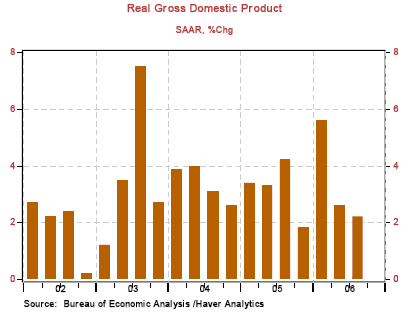
The overall GDP chain deflator was unchanged at 1.8 percent for the quarter, down from 3.3 percent in the second quarter, while core PCE came in at 2.2 percent, revised downward from 2.3 percent in the advance estimate. This is all good news for the Federal Reserve - with the statistics showing that both inflation and economic growth are moderating, fears of stagflation ease, but this data is now three months old and oil prices are now on the rise again.

Personal Income and Spending: Personal income rose 0.4 percent in October following a 0.5 percent increase in September. From year-ago levels, the increase in wages held steady at just under six percent. Spending rose 0.2 percent after a downwardly revised drop of 0.2 percent the prior month, this measure being influenced once again by less spending on nondurable goods, notably gasoline. The personal saving rate increased marginally to -0.6 percent, now in negative territory for more than a year.

Chicago Purchasing Managers Index: The Chicago Purchasing Managers Index fell below 50 for the first time since the spring of 2003. With a reading of 49.9, well below the expected increase to 55.0, this is evidence of continuing weakness in the Chicago area manufacturing sector. A reading above 50 indicates expansion, below 50 indicates contraction.

Leading the decline were measures for supplier deliveries that declined from 54.1 to 43.0, marking their lowest level in over five years. Employment was also very weak declining from 57.0 to 49.4, the lowest level in almost three years. Prices paid, while lower than in previous months, continue to provide support to this index.

Initial Jobless Claims: The increase of 34,000 new claims for unemployment insurance was surprising to many, as the consensus estimate was for a slight decrease from the week before. At 357,000, this is the highest level for new claims since the spring of 2004, excluding the Katrina-affected data from last fall.

While seasonal adjustments in a holiday-shortened week are responsible for some of the increase, this marks the third week of the last four with unusually high claims and the four week moving average now stands at 325,000, its highest level in six months. Recall that jobless claims closer to 400,000 per week are normally associated with a troubled job market.

Construction Spending: Weakness in both the residential and nonresidential sectors caused construction spending to fall a full 1.0 percent in October after a 0.8 percent decline in September. Private residential construction fell 1.9 percent, led by a decline of 3.9 percent in single family homes, while multifamily construction rose 1.6 percent.

Private nonresidential construction fell 0.7 percent, the second consecutive monthly decline, bucking the trend of recent months where the nonresidential sector continued to grow as construction of private residences fell. This is a significant development in that many observers had taken solace in the fact that the boom in nonresidential building had taken up the slack for waning residential construction. This now appears to be reversing also.

ISM Manufacturing Index: Confirming the Chicago area report on Thursday, the broader Institute for Supply Management's purchasing managers' index (PMI) showed that manufacturing is now contracting, down from 51.2 in October to 49.5 in November. This is the first time that the PMI has come in below 50 in more than three and a half years.
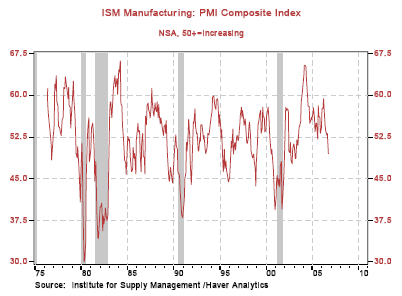
New orders and backlog orders now stand at 48.7 and 46.5, respectively, with prices paid remaining one of the dwindling number of components over the 50 mark. The two manufacturing reports this week confirm the slowing that has been building in recent months, finally showing up as economic contraction in the official manufacturing statistics.

Summary: This was an abysmal set of reports regarding economic growth. The higher than expected third quarter GDP growth and mild inflation reflect activity from three months ago, so as an indication of current trends, they are essentially meaningless. The continuing weakness in manufacturing and construction show no signs of abating, the important manufacturing indexes now showing contraction for the first time in more than three years. With the possibility of pressure in the labor market, something that may begin to show up in next week's labor report, and with commodity prices again on the rise, talk of stagflation is sure to be revived.

Charts courtesy of Northern Trust.

Read more...

Friday Lite

Friday, December 01, 2006

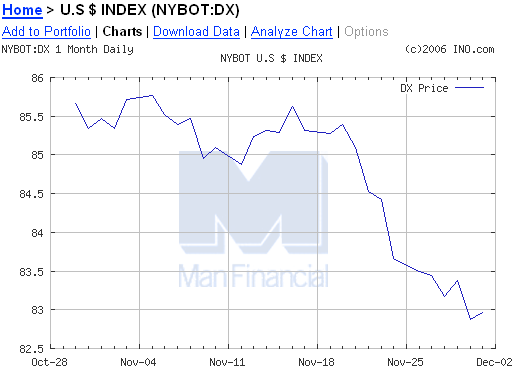
What a week for the dollar! What began early last week and was then nudged along by a few comments from a Chinese central bank official has turned into a bit of a rout. The 80 mark on the U.S. Dollar Index now stands as a sort of Maginot Line - once that level is breached, the picture changes dramatically.
Oh well, it's Friday. The greenback gets the weekend off.
The Difficulty in Assessing Changes to Home Prices

It's hard to know what to think about the housing market these days. About all you can really do is look around and see what's happening to real estate prices in your own neighborhood and draw whatever conclusions you can from that data.

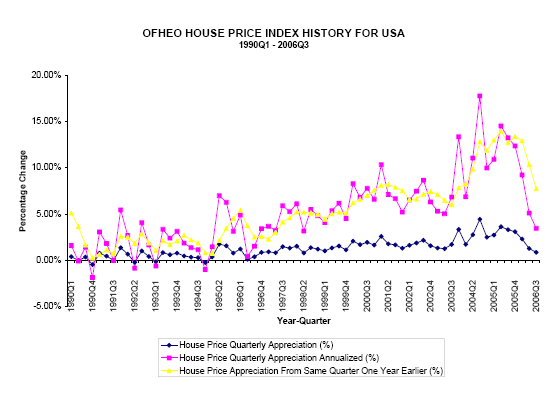
The national reports are in many cases confusing and contradictory, the latest example being yesterday's third quarter report (.pdf) from the OFHEO (Office of Federal Housing Enterprise Oversight) in which prices were shown to have increased almost eight percent from the same period last year.

The OFHEO data is unique in that it only tracks homes that are resold or refinanced and therefore has none of the "mix" problems for which the "median" home price data is often derided (e.g., sales of more higher priced homes causes the median price to go up regardless of whether prices are generally rising or falling).

Also, only Fannie Mae and Freddie Mac mortgage transactions are included, meaning that only conforming, conventional mortgages under $417,000 are used in determining the price trends. The historical data, including the results for the most recent quarter are shown below.
The annualized quarterly appreciation of 3.45 percent (the pink line) is at a level not seen since the late 1990s, and with the trend of the last five quarters, the next report will be anxiously awaited.

The price trends are skewed due to the use of appraised values for refinancings which are included along with actual home sales to determine the overall price index. Also, the national home improvement craze of recent years is not factored into the data in any way, meaning that some portion of the increase in home price should be attributed to money spent on home improvements rather than in the appreciation of the underlying asset.

The OFHEO data also omits the one-sixth of total home sales that are new construction, a valuable data point when determining overall price trends as can be seen clearly in the next section.

After Escrow Closes, You're On Your Own!

This ad came in the (e)mail the other day. It is not known whether this offer can be combined with the "We'll pay your mortgage for six months offer" or if it includes a free automobile.

**Price guarantee applies only if, at any time prior to the closing date for your residence, Centex Homes enters into a purchase agreement to sell any other home within the applicable project with the same plan type as your residence for a base price that is less than the base price for your residence as set forth in your contract. If applicable, your base purchase price will then be automatically reduced to the lower amount. This reduction shall not apply to any other monetary consideration or component of the purchase price for your residence, including without limitation, any lot premiums or the price for any options or upgrades. This reduction also does not apply to any lower base purchase prices established after you close escrow on your residence. Other conditions and restrictions may apply.
It sounds like there's some wiggle room there.

Sales Volume or Price Trends?

This story about an uptick in existing home sales that was, in part, enabled by lower sales prices makes it pretty clear that realtors have a very different way of gauging the health of the nation's real estate market than do many homeowners.
David Lereah, chief economist for the Realtors, said he expected home prices to continue falling for the rest of the year as sellers, accustomed to the booming market conditions of previous years, reluctantly cut their prices.

"Many buyers remain on the sidelines," Lereah said. "After a period of price adjustment, we'll see more confidence in the market and a lift to home sales should be apparent in the first quarter of 2007."
Since the sales report is from the National Association of Realtors, it's hard to object to quoting their chief economist, but it's not hard to object to his emphasis on increasing sales by encouraging price reductions. As documented in Freakonomics, in the end, realtors care much more about making the sale than about the seller getting the best price possible.

Please, Just Stop Talking - You're Only Making it Worse

Surely, retired Fed chief Alan Greenspan isn't doing his legacy any good by continuing to be a cheerleader for the economy that he left behind. According to this report, he's sticking to his story that the worst of the housing correction is now behind us.
Former Federal Reserve Chairman Alan Greenspan said on Tuesday that the worst of the housing adjustment was over, and that he was preparing to publish an analysis of the "serious dispute" over the true effect of mortgage wealth on consumer spending.
...
Greenspan said he expected inventory levels to come down at a "reasonably rapid pace" and that "it looks as though sales figures have stabilized." But he also said there would be actual price declines in housing. "That will have some impact on consumer expenditures," he said. "We haven't seen it yet."
A "reasonably rapid pace"? Is that like "kind of fast"? Many are now anxiously awaiting his latest analysis to be sure - Ben Bernanke must love having this guy around especially when he's in the news on the same day that the current Fed chairman gives a speech.

The Current Fed Chairman Gives a Speech

As noted in this story by Caroline Baum earlier in the week, tough talk from the Fed doesn't seem to be having the same effect that it used to.
Federal Reserve officials are getting a first-hand lesson in the law of diminishing returns: Try as they might, they can't seem to get the same mileage from their hawkish rhetoric.

In the past few months, every time a policy maker found a waiting platform, he or she used the opportunity to remind us that the Fed is more concerned about rising inflation than slowing growth.
The waiting platform occurred on Tuesday as Ben Bernanke expressed concern about inflation before the National Italian American Foundation in New York. The tough talk had a fleeting impact on the price of gold as shown in the chart below.
Wow! The impact of tough inflation talk used to linger for days, if not weeks. Now it looks like it completes the full cycle in about 90 minutes.
Gongolled

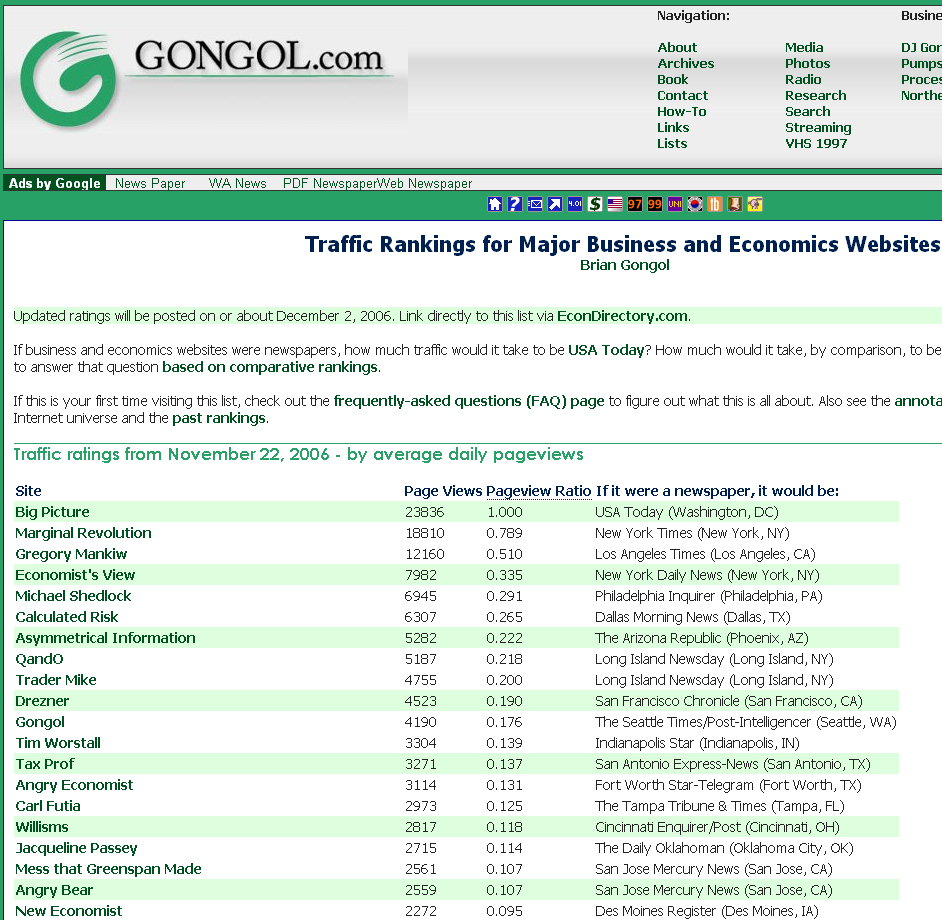
The Gongol website shows this little blog at #18 on the list of Major Business and Economics Websites. Who'd a thunk that? An LA Times article talks mostly about #2 on the list - Tyler Cowen at Marginal Revolution.

Click to enlarge

Of course Barry is at the top, and it's nice to see Mish and CR in the top ten. Hmmm... why are so many economists so angry? It still cracks me up to see the name of this blog in print and people continue to advise against ever changing it, but surely it has a limited life span.

Oil and Gold Guesses - Four Weeks to Go

This is the third to last update of the chart for guesses at the year-end oil and gold prices where dozens of you entered to win a free one-year subscription to Iacono Research. A big move was made in the two weeks since the last update, and the yellow-dot has moved to the area of the chart with the highest density of guesses.
There are three or four guesses at $66 and $666 - something about that combination seemed irresistible to a few of you and right now that's looking like a pretty good combination (the $90 and $900 can probably be ruled out, along with the $48 and $530).

Dubai Plans First Rotating Skyscraper

No, this story is not from The Onion - it is real.
The Arab city with the palm-shaped islands and the sail-shaped hotel is adding to its eclectic skyline by building the world's first rotating skyscraper, a 30-story apartment tower that revolves on its base.

The tower, announced Wednesday, will use the Persian Gulf's abundant sunshine to power the building's slow rotation that brings it full circle once a week, said Nick Cooper, a British engineer designing the rotation mechanism.
The developer promised that it will move very slowly, that it's not a theme park ride.

Read more...

Let's Light this Candle

Thursday, November 30, 2006

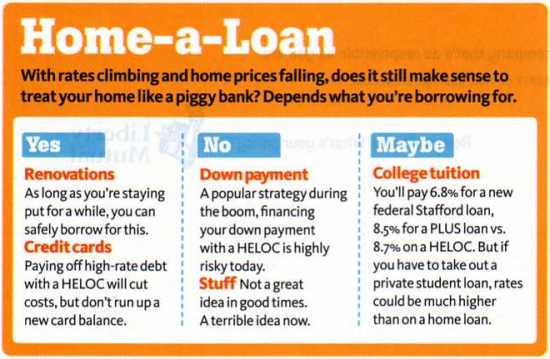
With short-term interest rates now prohibitively high, the "financial innovation" known as the Home Equity Line of Credit (HELOC) has lost much of its luster. It now seems destined for the nostalgia bin along with 80-20 loans and the idea of spending your home equity like a drunken sailor on shore leave.

The appeal of HELOCs has rapidly waned with the combination of monthly repayment rates now double what they were just a couple years ago and falling home prices that make "refinancing-away" HELOC debt much more difficult than back in 2004.

Gone are the days when you could borrow on credit cards, pay off the credit cards with newly borrowed HELOC money, then make the HELOC debt vanish by rolling it into a refinanced mortgage with a higher loan balance and a lower interest rate.
The magic of it all was that you could keep that all-important monthly mortgage payment the same - maybe even bring it down. It seemed like a perfect sort of "perpetual motion machine" for a while.

A real "financial innovation" as the economists at the Chicago Fed might call it.

In this article from the December issue of Money Magazine, Gerri Willis takes a critical (and slightly naive) look at these once popular ways to "extract" money from your home. She starts out by reminding us all that not more than a couple years ago, homeowners were being encouraged to "tap their equity" for all sorts of things - buying stocks, buying investment real estate, adding a wing to the house, you name it.

Looking back, that kind of advice brings to mind office clerk Stuart's 1999-era urging to his boss Mr. P to go online and trade stocks. "Let's light this candle", he famously said in the Ameritrade commercial.

Surely, in recent years, someone used that same phrase when first "tapping their equity".

Well, now it's 2006, and it seems that many homeowners have been forcibly brought to their senses by the relentless Greenspan/Bernanke "baby-step" campaign of raising short-term interest rates from the absurdly low, "pedal-to-the-metal" rate of one percent, back up to a more reasonable level of just over five percent.

So what are HELOCs good for now? Money Magazine provides a summary in this table.
It appears they are pretty much useless now.

Well, maybe not useless, but certainly not nearly as much fun as a couple years ago when many a homeowner literally attempted to spend their home equity faster than it accumulated.

By the looks of recent foreclosure statistics, many of them appear to have succeeded.

A Personal Story

In keeping with this week's theme of retrospectives, my home equity "candle lighting" experience is shared today - something that can be looked back upon now with some degree of wonder, knowing how many millions of other homeowners had a similar experience.

It was early 2002 and layoffs, "furloughs", and downsizing dominated the technology industry. A new car was needed as the infernal "Check Engine" light on a 1996 Ford Mustang had continued to torment its owner, ultimately resulting in a pledge to never again buy an American car.

There was plenty of cash in the bank, but not enough to completely cover the cost of a new car and, as expected, the dealer would not offer much in trade regardless of whether the "Check Engine" light could be temporarily defeated by pulling the battery cable.

After visiting a few dealers and deciding on the make and model, the necessary research at Edmunds and Consumer Reports was completed to determine a fair price and then came the magic.

The lighting of the candle.

The "extraction" of the five-figure sum was surprisingly easy. With the click of a mouse, the transfer was initiated and a day later it showed up as a deposit in a checking account - ready to go.

Like money from above.

A purchase decision was made and a check was proudly written to cover the entire cost of the new car, like a rich little old lady that paid cash for everything. The salesman must have been impressed. His offer to help with the financing had been casually rebuffed.

Naturally, a few months later the HELOC balance was rolled into a refinanced mortgage and it disappeared, the monthly mortgage payment was lowered, and the cycle was completed, ready to go again.

Financial innovation at its best.

Read more...

Buying Bullion

Wednesday, November 29, 2006

During the early part of the decade, when others were refusing to look at their brokerage statements, afraid of seeing the dollar amounts that might appear next to their favorite tech stocks, the first few tentative steps were taken here toward what is now a well developed portfolio of commodity-related investments.

Buying gold and silver mining stocks was easy - buying bullion was another matter.

~~~~~~~~~~~~~~~~~~~~~~~~~~~~Advertisement~~~~~~~~~~~~~~~~~~~~~~~~~~~

You wouldn't know it by listening to CNBC, but some commodity portfolios are now within shouting distance of the May highs. At Iacono Research it shapes up like this:

Model Portfolio Performance - Week:+3.7%, Month: +4.9%, Year: +25.5%

Quiet gains are always better - there will be plenty of time for a mania in a few years. That's when exit strategies are best planned. For a free, no obligation two-week trial, click here. For subscription options, click here.

~~~~~~~~~~~~~~~~~~~~~~~~~~~~~~~~~~~~~~~~~~~~~~~~~~~~~~~~~~~~~~~~~

Mutual funds holding precious metal mining stocks have been around for a very long time now and they have quietly risen by 300 percent, 400 percent, or more in the last five years. That's the way most people take their first plunge into the gold sector - buying a fund that holds mining stocks.

Funds such as U.S. Global Investors World Precious Minerals (UNWPX) give you about all that you could ever want from a precious metals stock fund. There are dozens of funds available in this sector and in the relatively small world of gold mining stocks they all move in the same general direction. This offering from U.S. Global Investors happens to be one of the better performers.
Clearly, the year 2001 was when everyone should have loaded up the truck and just sat tight for the next five years. But after considering that during the four years before 2001 the fund above averaged a loss of 27 percent per year, few could possibly have been that bold.

That's the problem with going against the crowd, you can be wrong for a long period of time and look pretty dumb in the process. If you were convinced that the late 1990s would see the resurgence of another great gold bull market, you were probably disappointed as everyone else was furiously plowing money into tech stocks, helping to rewrite the history books in the process.

But aside from the not-so-small matter of timing, buying gold stocks has always been pretty easy.

Gold and Silver Coins and Bars

The purchase of precious metal bullion, on the other hand, was an entirely different matter until ETFs began launching just two years ago. Today, with gold offerings like the StreetTracks Gold Shares (GLD) and iShares Comex Gold Trust (IAU) and a similar product for silver in the iShares Silver Trust (SLV), buying bullion couldn't be easier.

For those making purchases before gold and silver were just a mouse click away, the gains have been much greater, but even those who jumped in on the first gold ETF back in December of 2004 are looking pretty smart today.

Of course they probably didn't feel very smart for much of 2005.
Most people probably never even considered precious metals as an investment option until they were made easy for them to buy - a lesson that should be heeded when considering the purchase of shares for small Canadian mining companies that present similar difficulties in their acquisition.

If you purchased gold or silver bullion more than a couple years ago, there were other options available that still exist today, even after the increased competition from ETFs - GoldMoney and the Central Fund of Canada (CEF) come quickly to mind.

But probably the best way to buy bullion is the same way that people have been doing it since gold ownership was again legalized in the 1970s - buying coins and bars from coin dealers. You'll never know what a thrill it is to take that first trip down to the post office to pick up that first registered mail package with the odd handling characteristics.

You see, gold is very dense, and when it is packaged inside of a much larger box, the box tends to "spin" around the mass in the middle. Silver has its own density problems, this one mostly having to do with sheer weight - if you ever get the opportunity, try holding a handful of pre-1966 silver coins in one hand (90 percent silver) along with the same dollar amount of recent coinage in the other.

Today's coins, made mostly of copper, feel and sound almost like "play money".

You can also just walk into a coin shop, but today you're more likely to see people selling than buying - it's kind of depressing and ironic at the same time actually. It is surely a sign of the times when soaring metal prices cause financially stretched individuals to sell family heirlooms or other precious metals - all during an era of supposedly low inflation.

Something's wrong with that picture, but it shouldn't discourage you from picking up some gold or silver coins - if for no other reason than to experience what money used to feel like.

Disclosure

None of the mutual funds or ETFs above are currently owned by the author however, similar items are included in the model portfolio at Iacono Research.

Read more...

Wither the Equity Cushion

Tuesday, November 28, 2006

Who knows, maybe this week's posts will have a common theme too - last week it was movies, so far this week it's retrospectives. Yesterday the "incredible shrinking dollar" talk of two years ago was recalled and today the idea of "equity cushions", popularized during the height of the housing boom last year, are the subject of discussion.

You don't hear too much about "equity cushions" anymore.

It was just over a year ago when the term was first stumbled upon here. It had been used judiciously by Federal Reserve officials and others in the latter part of 2005 when falling home prices were still just a twinkle in the eyes of housing bubble bloggers.

At the time, the mainstream media still anxiously awaited every word that outgoing Fed Chairman Alan Greenspan uttered, such as "froth" sightings in local housing markets (the mainstream media has a decidedly different take on the old man's work today).

As the story goes, back in the first half of the decade, rising property values had created an "equity cushion" for nearly all homeowners. A cushion that would protect homeowners from many ills including the adverse effects of falling home prices, that is, in the hypothetical case where prices might actually decline.

A website for real estate agents has an interesting definition of the term:
Hmmm...

As most people probably no longer keep up with the latest in neighborhood home price trends (kind of like looking at brokerage statements in 2001), many homeowners probably don't even know their equity cushion is now withering away.

In the Beginning

As it relates to the housing boom, the term "equity cushion" appears to have its origins in this speech by San Francisco Fed Governor Susan Schmidt Bies in April of last year.

Another concern is that house prices will reverse and erase a considerable amount of home equity built up in recent years. Recent gains in house prices have been notable: the average house price rose 11 percent in 2004, and cumulative gains since 1997 now top 65 percent... It is true that some households have considerably less equity in their homes, and these households tend to have lower income and fewer other financial assets to cushion shocks.
This address by Fed Chairman Greenspan last September appears to have formalized the term, defining both its size (sizeable) and its primary usage (absorbing declining home prices).
In summary, it is encouraging to find that, despite the rapid growth of mortgage debt, only a small fraction of households across the country have loan-to-value ratios greater than 90 percent. Thus, the vast majority of homeowners have a sizable equity cushion with which to absorb a potential decline in house prices.
Shortly after the Fed chairman's comments above, Ms. Bies was again at it with this speech.
Despite the apparent decline in underwriting standards, less than 5 percent of outstanding mortgages have a loan-to-value ratio greater than 90 percent, which means that the vast majority of homeowners have a significant equity cushion; in the event prices fall, only a very small percentage of owners are likely to see their debts exceed the value of their homes.
At about that same time last year, the story of Ms. Rodriguez and her equity cushion showed up in the LA Times. In the post "Equity Cushion Possibilities", alternatives to the rosy scenario of perpetual equity cushion inflation were considered (Oops! Almost forgot - rising house prices don't count as inflation).

How Times Have Changed

Today there is a real problem with the "cushion" metaphor for home equity - a problem that is only seen when the amount of home equity changes from a positive number to a negative one, as is the case for many 2005 home buyers.

Earlier this morning it was learned that median home prices are down 3.5 percent nationally from year ago levels. In some parts of the country, prices are down ten percent or more from this time last year and given the lax lending standards in recent years, where many homebuyers put no money down, many new homeowners are "upside down" today.

The problem with "equity cushions" is that once the amount of home equity passes from positive to negative, the metaphor fails. In the case of zero equity, a flat seat cushion presents the proper picture. What was once a comfortable spot for someone's derriere is now a hard flat surface, inflexible and unyielding to the shapes and contours that are placed on it.

Uncomfortable, but not problematic.

But, for the case of negative home equity, how can more stuffing be removed from the "cushion" than the cushion had to begin with? Further, what would happen if you sat on an "equity cushion" that was in this condition?

When market forces or financial innovations such as mortgage equity withrawal have caused the removal of more stuffing than the cushion contained, a physicist might argue that the stuffing has to come from somewhere. Maybe parts of the chair become transformed from wood into stuffing causing the chair to become less stable - less likely to support the weight that it used to.

Who knows.

Another metaphor is clearly needed - equity cushions are so "2005".

Read more...

The Disappearing Dollar

Monday, November 27, 2006

There was lots of talk over the weekend about the U.S. Dollar after its performance on the foreign exchange markets last week. Another Chinese central banker commented that they are tiring of accumulating dollar denominated assets in their $1 trillion of reserves, but they're not sure what else to buy.

They'll probably figure something out - maybe soon.

If there is a plunge protection team somewhere out there for the currency markets (well, in addition to the Bank of Japan) let's hope they don't still have a turkey hangover - they may need their wits about them this week.

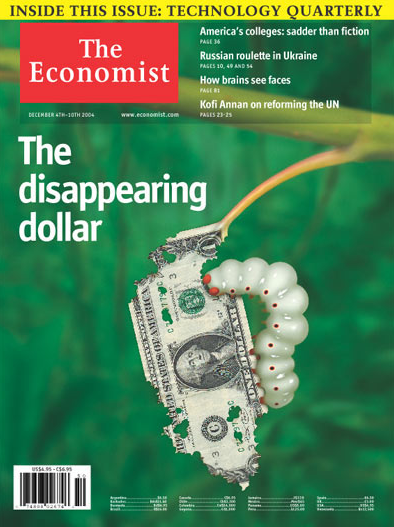
All this brings back memories of what people were saying a couple years ago. After recalling the last time the world feared a dollar death spiral, the following cover from The Economist was retrieved - almost exactly two years ago:
After a little closer inspection of the contents of this issue, it begins to feel like a sort of dollar time warp - as if everything related to the standing of the U.S. Dollar as the world's reserve currency was put on hold for two years while Alan Greenspan did his "baby step" routine for another year, the U.S. housing market boomed, and all seemed right for the world's only superpower (aside from the obvious problems encountered while spreading democracy).
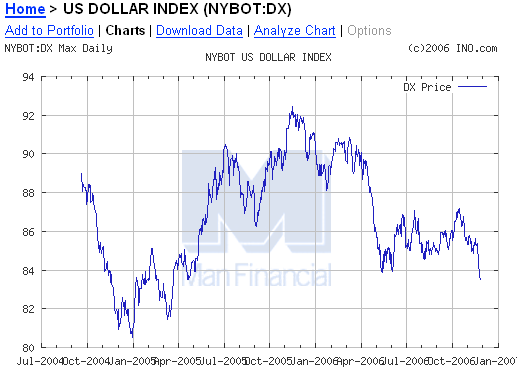
The dollar last plunged to the 80 mark on the U.S. Dollar Index back during the last days of December in 2004. With the move down last Friday, it looks ready to retest that level.
Here's the cover story($) originally published in the December 2nd, 2004 print edition:

How long can it remain the world's most important reserve currency?

THE dollar has been the leading international currency for as long as most people can remember. But its dominant role can no longer be taken for granted. If America keeps on spending and borrowing at its present pace, the dollar will eventually lose its mighty status in international finance. And that would hurt: the privilege of being able to print the world's reserve currency, a privilege which is now at risk, allows America to borrow cheaply, and thus to spend much more than it earns, on far better terms than are available to others. Imagine you could write cheques that were accepted as payment but never cashed. That is what it amounts to. If you had been granted that ability, you might take care to hang on to it. America is taking no such care, and may come to regret it.

The cost of neglect
The dollar is not what it used to be. Over the past three years it has fallen by 35% against the euro and by 24% against the yen. But its latest slide is merely a symptom of a worse malaise: the global financial system is under great strain. America has habits that are inappropriate, to say the least, for the guardian of the world's main reserve currency: rampant government borrowing, furious consumer spending and a current-account deficit big enough to have bankrupted any other country some time ago. This makes a dollar devaluation inevitable, not least because it becomes a seemingly attractive option for the leaders of a heavily indebted America. Policymakers now seem to be talking the dollar down. Yet this is a dangerous game. Why would anybody want to invest in a currency that will almost certainly depreciate?

A second disturbing feature of the global financial system is that it has become a giant money press as America's easy-money policy has spilled beyond its borders. Total global liquidity is growing faster in real terms than ever before. Emerging economies that try to fix their currencies against the dollar, notably in Asia, have been forced to amplify the Fed's super-loose monetary policy: when central banks buy dollars to hold down their currencies, they print local money to do so. This gush of global liquidity has not pushed up inflation. Instead it has flowed into share prices and houses around the world, inflating a series of asset-price bubbles.

America's current-account deficit is at the heart of these global concerns. The OECD's latest Economic Outlook predicts that the deficit will rise to $825 billion by 2006 (6.4% of America's GDP) assuming unchanged exchange rates. Optimists argue that foreigners will keep financing the deficit because American assets offer high returns and a haven from risk. In fact, private investors have already turned away from dollar assets: the returns on investments in America have recently been lower than in Europe or Japan. And can a currency that has been sliding against the world's next two biggest currencies for 30 years be regarded as “safe”?

In a free market, without the massive support of Asian central banks, the dollar would be far weaker. In any case, such support has its limits, and the dollar now seems likely to fall further. How harmful will the economic consequences be? Will it really undermine the dollar's reserve-currency status?

Periods of dollar decline have often been unhappy for the world economy. The breakdown of Bretton Woods that led to a weaker dollar in the early 1970s was painful for all, contributing to rising inflation and recession. In the late 1980s, the falling dollar had few ill-effects on America's economy, but it played a big role in inflating a bubble in Japan by forcing Japanese authorities to slash interest rates.
That all sounds familiar. The prediction "the dollar now seems likely to fall further" wasn't particularly timely, but they never did say "when". It is likely that "when" is about "now".

This article($) about high oil prices also appeared in that same issue. Two years on, it seems quaint to see amounts like $20 and $30 in the same sentence as the words "barrel of oil".
“HISTORICALLY, OPEC is in its best position ever.” So declared Iran's president, Mohammed Khatami, before he met Venezuela's president, Hugo Chávez, this week. Mr Chávez agreed, and vowed to “defend” today's oil price of around $50 a barrel when OPEC, the Organisation of Petroleum Exporting Countries, holds its next meeting, in Cairo on December 10th. One Iranian oil official said this week that $50-70 was “not really a high price”.

This is not what consumers want to hear. Oil prices have shot up from around $10 a barrel in 1998 to their current heights, with predictable consequences at the petrol pump. Yet talk of higher oil prices may sound odd just now, because lately the market has gone off the boil. The price of West Texas Intermediate has cooled from $55 in mid-October to $45-50. And there are other signs that could mean prices fall further if OPEC does not try to support them by agreeing on a cut in members' production quotas next week.
...
What is more, demand seems to be easing. China's surge in oil consumption appears to be slowing. The OECD's Economic Outlook, published this week, concluded that high oil prices have started to act as a short-term drag on the global economy—which ought in turn to weigh on oil demand. In any case, demand slows in the second quarter of the year, with the change of the seasons.
...
There are other reasons to think the oil price will stay strong. Paul Horsnell of Barclays Capital, an investment bank, claims that the rise in oil prices over the past two years “reflects structural rather than cyclical issues.” One cause is that the bloated and growing welfare states of many oil economies require ever higher oil prices to sustain them. Another is that global demand—especially in emerging giants like China—appears to be less sensitive to price increases than previously thought.
...
Maybe the Saudis will succeed in stabilising prices around a new plateau, perhaps the $30-34 range of which Mr Naimi spoke, maybe higher. The trouble is that the relative price stability, between $20 and $30, of much of the late 1980s and 1990s was due in large part to OPEC's then huge spare capacity. That is now gone, and any Saudi expansion will take time.
A plateau higher than $30-34 appears to have been achieved.

And what retrospective is complete without an economist's view on gold, a subject that had become increasingly popular as the metal's price first poked through the $450 level two years ago. In this story($) from that same December 2004 issue, the case is made that a falling dollar is not necessary for gold to rise.
MOST economists hate gold. Not, you understand, that they would turn up their noses at a bar or two. But they find the reverence in which many hold the metal almost irrational. That it was used as money for millennia is irrelevant: it isn't any more. Modern money takes the form of paper or, more often, electronic data. To economists, gold is now just another commodity.

So why is its price soaring? Over the past week, this has topped $450 a troy ounce, up by 9% since the beginning of the year and 77% since April 2001. Ah, comes the reply, gold transactions are denominated in dollars, and the rise in the price simply reflects the dollar's fall in terms of other currencies, especially the euro, against which it hit a new low this week. Expressed in euros, the gold price has moved much less.

However, there is no iron link, as it were, between the value of the dollar and the value of gold. A rising price of gold, like that of anything else, can reflect an increase in demand as well as a depreciation of its unit of account.

This is where gold bulls come in. The fall in the dollar is important, but mainly because as a store of value the dollar stinks. With a few longish rallies, the greenback has been on a downward trend since it came off the gold standard in 1971. Now it is suffering one of its sharper declines. At the margin, extra demand has come from those who think dollars—indeed any money backed by nothing more than promises to keep inflation low—a decidedly risky investment, mainly because America, with the world's reserve currency, has been able to create and borrow so many of them. The least painful way of repaying those dollars is to make them worth less.
Of course, as last Friday's gold price movement demonstrates, a falling dollar can certainly help the price of the "irrelevant commodity".

Read more...

No, Seventy Five Dollars

Sunday, November 26, 2006

It's only a matter of time before the folks at Saturday Night Live come up with a parody for the fading housing boom like they did when the stock market took a header a while back.

Until they do, here's one from Flipper Nation:


Nice work!

Buy it, fix it, sell it.

The guy at IAmFacingForeclosure.com doesn't even seem to realize that it's a parody.

That explains a lot.

The SNL crew had a great piece on consumer debt back in February as transcribed here (the video is available somewhere on the internet) - it's only a matter of time until they catch up with the flippers.

ooo

Last week's cartoon from The Economist:


Read more...
IMAGE

  © Blogger template Newspaper by Ourblogtemplates.com 2008

Back to TOP