


![[Most Recent Quotes from www.kitco.com]](https://lh3.googleusercontent.com/blogger_img_proxy/AEn0k_uetcAGVbDBqwAKVEsjcWXXwEtpOq8ArhY0xCS38J2vY8cylJuWUKMvyRHNHRew40sa4hX3of_0iDX1ZcPoMrPuoT4XrctKFhT18KTKp-IiGfNTFQsNPuWsKqWlCBOK=s0-d)
![[Most Recent Quotes from www.kitco.com]](https://lh3.googleusercontent.com/blogger_img_proxy/AEn0k_tR9gH39kpBYOcHLIiipU-8b-fotARdW98JhkUlZSjZ2Br8vmBne3WDGlBEqpsrel77ViOxVeW8M1plZm4w635g-bG-q78aIlzy4IaSSeiSfeN6ofZ-MoxUjcFv_slhXrA=s0-d)
![[Most Recent USD from www.kitco.com]](https://lh3.googleusercontent.com/blogger_img_proxy/AEn0k_uqA3uEBfINMGEHGdeAUrCXPAeTG9soU0OT2SpqgnKSDqAQ0-tEdLa3WsneIFWQD7bzITMZUsyRb22ygNlr0zwwxbM11AnyTh6V2fpjT6eUaOCluXR4MAfX=s0-d)


A Final Word on Housing Costs and the CPI
Monday, October 17, 2005
For anyone questioning the methodology used in my previous post today, please take note of the following chart. It is generated directly from BLS data using the database query at CPI home, and it tells the story all by itself.
This link will take you directly to the query page, and after a little fiddling with formatting options, you get this: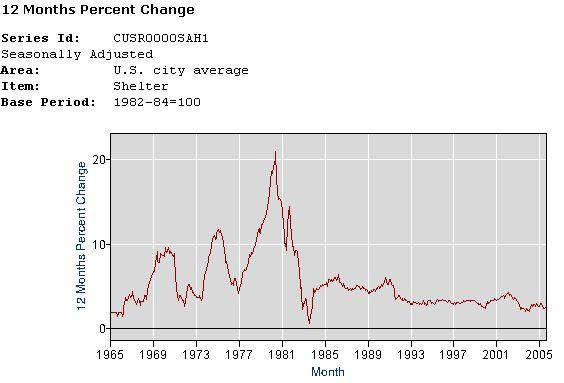
Shelter includes the following subcategories and weightings (as of 2003):
Something very significant happened in 1983 when owner's equivalent rent replaced the previous inflation calculation for owner-occupied housing. The older data, using the previous calculations for owner-occupied housing, is not available via the BLS, but it is clear that it would closely follow the above curve pre-1983, given the make-up of the shelter category.
Falling interest rates do not explain the low and stable shelter inflation on this chart.

4 comments:
The line is much smoother now, and lower. Smoother and lower, when it comes to inflation, are much better than wiggly and higher.
Hey Anon,
but the point Tim is hinting at is that inflation didn't get more or less volatile, but the CPI measurement of inflation did. So, the change had the convenient consequence that inflation looked nicer after this change, no matter what was actually going on out in the real world.
VHB
Anonymous,
Take an extreme hypothetical example. The CPI calculation is changed to only reflect the change in price of one product, say tennis balls. Now, if the price of a tennis ball remains the same over 20 years, CPI will remain flat. But you can't eat tennis balls. You can't live in a tennis ball. CPI is supposed to reflect the cost of living - and living includes food, housing and myriad other products.
When you substitute the actual cost of owning a home with the theoretical cost of renting that same home if you didn't own it, you are including a bogus number in the calculation. The person who purchased a home may be paying $5000 a month for mortgage/maintenance/taxes/insurance, but the CPI will only count the estimated $2300 monthly rent he would be paying if he rented that house instead of owned it.
Where did that other $2700 go? It was simply excluded. We had a term for this in high school science classes. It was called "fudging the numbers".
It's really this simple! If you adjust the numbers to make it fit your building your building will eventually fall down.
Post a Comment