


![[Most Recent Quotes from www.kitco.com]](http://kitconet.com/charts/metals/gold/t24_au_en_usoz_2.gif)
![[Most Recent Quotes from www.kitco.com]](http://kitconet.com/charts/metals/silver/t24_ag_en_usoz_2.gif)
![[Most Recent USD from www.kitco.com]](http://www.weblinks247.com/indexes/idx24_usd_en_2.gif)
A Chart for the Cassandras
Monday, August 01, 2005
Of all the items that have been published on this blog, there is one chart that keeps popping back into my head - the chart of job creation in San Diego, California over the last fifteen years, broken down into five-year segments.
It recently became clear why this chart keeps re-entering my consciousness.
It seems that the mainstream financial media and the White House are now in the midst of a massive "anti-housing bubble" media blitz - an obvious attempt to counter all the housing bubble analyses and articles that have been showing up online and in local newspapers over the last few months. Apparently, this is an attempt to avoid a calamity where everyone wises up at the same time - drive home some simple talking points so no one panics.
Based on having read so many convincing analyses and articles making the case for the existence of a housing bubble, by many highly respected analysts and scholars, each time one of these "anti-housing bubble" stories reaches my ears, my reflexive response is to think of this chart.
We'll get to the chart in just a minute.
Rose Colored Glasses
It seems that Treasury Secretary Snow, Commerce Secretary Gutierrez, Chief White House Economic Adviser Bernanke, and other White House representatives are all popping up on CNBC or writing articles for mainstream business publications, all carrying the same message:
Economists and real estate executives appear on CNBC or write more articles for business publications making the case that the housing market is driven by strong fundamentals - a healthy economy with strong job growth and low mortgage rates which are in large part due to low inflation expectations.
On the surface this all sounds so good, and surely, many people who hear these numbers repeated over and over feel assured that all is well, despite what they see happening in the labor market or with prices they pay for goods and services. Anyone who knows the details of how these statistics are calculated, knows that they don't tell the whole story, and in fact are, by design, consistently overstating real growth, understating inflation, and misleading when reporting unemployment.
The one government statistic that is not regularly questioned is the non-farm payrolls number reported on the first Friday of each month - the July report is due at the end of the week. Non-farm payrolls have increased nationally by over 3 million since the spring of 2003 when the current recovery kicked into gear. And, while this job creation is quite low by post-war recovery standards, no one really disputes that these jobs have been created.
It is the type of jobs being created that make today's economy and this economic recovery atypical - an economy far too dependent upon housing related jobs and rising real estate prices.
The Chart
So, here's the chart - straight from the California Economic Development Department, having previously appeared in this post a couple weeks back. While San Diego does not necessarily representative the rest of the country in its job creation trends, it does demonstrate the unhealthy relationship between the economy, job creation, and the housing bubble in this one area - this being one of the most mature housing bubbles in the country.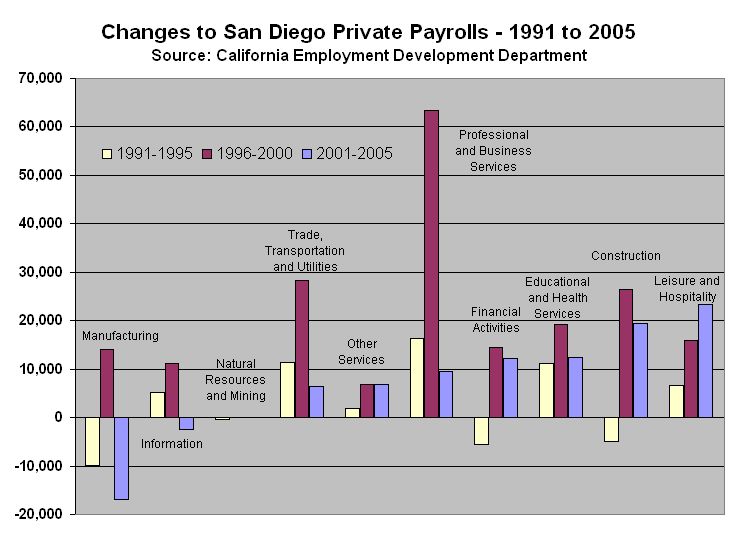
Click to enlarge
If you look at the three periods, what first stands out are the red bars. The red bars are much bigger than either of the other bars, as they represent the late 1990s technology jobs boom where nationally, over 14 million jobs were created in this five-year period. And, look at all the Professional and Business Services jobs - legal, architectural, engineering, scientific research and development, technical services, etc. Most people find it easier to accept the decline in manufacturing jobs when good services jobs are abundant. The relative weighting of job creation by category also seems reasonable. For 1996 to 2000, the top three were:
Looking at the yellow bars shows a dearth of new jobs, and notice the net loss of construction jobs over this period - this was during the last housing decline in Southern California, when prices fell up to 40% in many areas from their 1990 peaks. During this period from 1991 to 1995, again the relative weighting of jobs by category seems reasonable:
Finally, the blue bars - the unhealthiest of all bars. In this data set, Professional and Business Services ranks fifth! Knocked out of the top spot of the previous ten years, even trailing Financial Activities, which includes the recently hot job categories of Credit Intermediation and Real Estate. The top three this time are:
We can ignore Education and Health Services, as it is not germane to this discussion - this category has been a steady producer of jobs both nationally and locally, but has little to do with the housing bubble. Construction jobs, on the other hand are quite germane to this discussion. In fact the ratio of Construction jobs to Professional and Business Services jobs for the two periods 1996-2000 and 2001-2005 is probably the most disturbing part of this entire chart. The relationship between these two categories, roughly a two-to-one ratio, has completely switched between these two periods:
When you see what happened to the Construction category during the last housing decline in the early 1990s, it is hard not to think that there will be some severe repercussions to the economy as a whole, if there is a significant decline in demand for construction workers and specialty trade contractors (e.g., granite countertop installers).
Lastly, the Leisure and Hospitality category, leading all other categories over the last five years, consisting predominantly of restaurant help, does not seem to indicate a strong base for future economic expansion - not if people begin to cut discretionary spending in the wake of stagnating home prices and the eventual reversal of the housing wealth effect.
Pollyannas
Every time a cabinet member speaks about the health of the economy, or a Wall Street economist opines about historically high home ownership rates, or the CEO of a home building company remarks about the strong fundamentals that power today's housing market, this chart comes to mind.
It is a picture of the job market in one part of the country that clearly shows an unhealthy response to the monetary and fiscal stimulus applied after the stock market bubble burst in 2000. While this is only one county in California, the job creation patterns evidenced here are surely similar to many other areas in the U.S. - job creation that is based far too much on housing and rising real estate values, rather than what one would expect from a healthy service-based economy.
What category will lead the way in job growth for the rest of the decade?
Probably Education and Health Services.

1 comments:
It would've been nice to have created some jobs in something like alternative energy sources over the last few years instead of all these housing jobs.
Post a Comment