


![[Most Recent Quotes from www.kitco.com]](http://kitconet.com/charts/metals/gold/t24_au_en_usoz_2.gif)
![[Most Recent Quotes from www.kitco.com]](http://kitconet.com/charts/metals/silver/t24_ag_en_usoz_2.gif)
![[Most Recent USD from www.kitco.com]](http://www.weblinks247.com/indexes/idx24_usd_en_2.gif)
Los Angeles Overtakes San Diego
Wednesday, September 14, 2005
Los Angeles has finally overtaken San Diego in median home price - that's what yesterday's DataQuick report on August Southern California real estate sales shows. Not since the summer of 1999, when the median home price in Los Angeles and San Diego were both about $200,000, were prices for these two counties so close.
It seems funny to even type that last sentence - just to have "median home price", "Los Angeles", and "$200,000" all in the same sentence seems very strange.
It's only been six years - from $200,000 to $500,000.
What a country! What monetary policy! What lenders!
The median home price charts for all Southern California counties have been updated to include the August sales data. Data going back to 1999 is now included, and once again this month, San Diego is the laggard in price gains, with most other counties still going strong.
Click to enlarge
The year-over-year change in median home price chart (below) has also been updated to add four years - it now goes back to 2000. Of note here is that San Diego is now boasting a sickly 2% year-over-year price increase from last August.
We've previously projected October for San Diego to cross into negative territory. That will be odd - the last time a Southern California county had a negative year-over-year price change was in Ventura County back in early 2001.
Recall that it was December of 2000 when the Fed Funds rate began its descent from what at the time seemed like a rather ordinary level of 6.5%. By December 2001, the Fed Funds rate was 1.75%, a year later it was 1.25%, and a year after that it was 1.00%.
The chart clearly shows how yearly housing appreciation went from the 10% range in 2000 up into the 20-30% range once the low rates kicked in.
Click to enlarge
This next chart is a five month moving average of the above chart. In addition to being a lot less cluttered and generally easier to look at, a few trends begin to emerge. Trends that are clear are the price action in 2002 and again in 2004 - both these periods have rapidly rising year-over-year appreciation, while 2003 looks to be the year when everyone took a break.
It would be interesting to see the 10 year treasury yield plotted against these price changes. The year 2002 is when the low rates first affected the housing market, but the period of early 2004, if memory serves, was the period when the Japanese printed up enough Yen to buy around $300 billion in U.S. Treasuries, single-handedly forcing long rates back down below 4%.
Last year was also the time when lenders began to get really creative, after things seem to have leveled off a bit the year prior.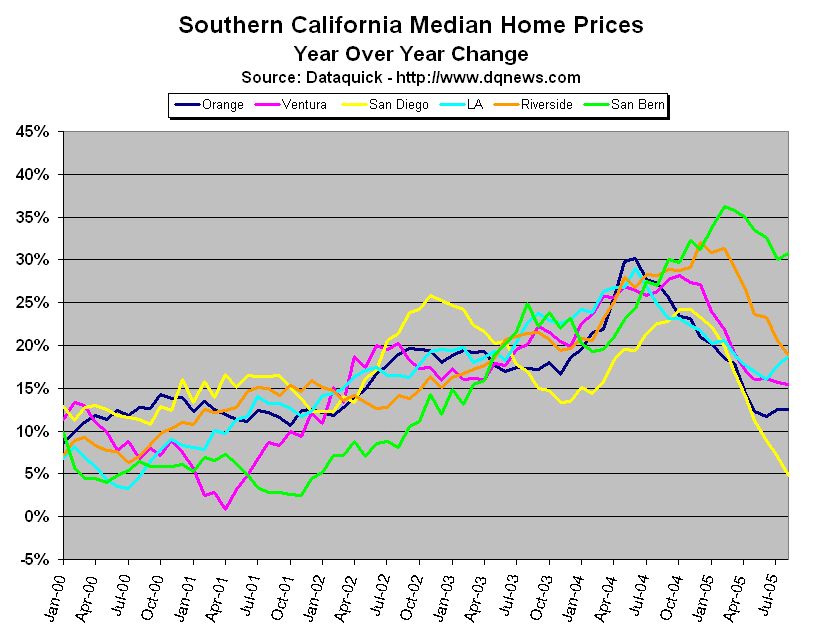
Click to enlarge
Next is a ten month moving average of the same data. Not much different really, just smoother. We can clearly make out some interesting relationships between lines of different colors - again the yellow line is of particular interest, but the green line is intriguing as well.
First, it is clear that San Diego was the leader in price appreciation from early 2000 until mid 2003. While San Diego was gaining at a rate of 15% a year, most other counties were in the 10% range. San Diego was the first county to break through the 25% barrier, but since mid 2003, it has been lagging all other counties.
Low priced San Bernardino County is almost the opposite of San Diego County in price patterns - it languished during the heady San Diego years early in the decade, but since mid 2003, San Bernardino is the clear leader. Three years ago, the ratio of San Diego median home price to San Bernardino median home price was more than 2-to-1. Last month, for the first time since this data series begins in 1999, it is less than 1.5-to-1.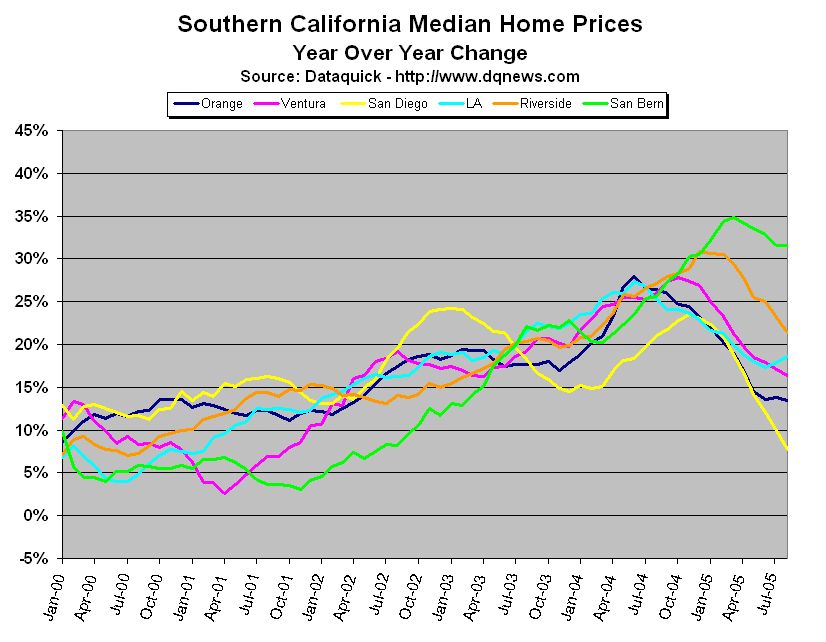
Click to enlarge
What does all this mean? Who knows? Whatever it means, it's not good for San Diego.
Sure they're building more condos in San Diego, and there are probably other factors in play here, but we're talking about 4000-5000 home sales per month for most of these counties, and the fact remains that for markets of comparable sales volume, the trend is unmistakable - the boom has left San Diego and if any real estate markets go bust in this part of the country, San Diego will likely be the first.
One other thing to consider here is that the price changes may really be worse than indicated on these charts. With the ever increasing size of new homes being built these days, there is a natural upward bias in home prices (e.g., if price per square foot remained steady, home prices would go up due to increased square footage).
Also, as many Southern California homeowners have tapped their home equity for various home improvement projects in the last few years, in many cases many tens of thousands of dollars, when these homes are resold, these improvements also have an upward bias to sales price.
That yellow line is just fascinating to watch every month.

3 comments:
Nice charts - glad to see you back.
The construction costs for a 2200 sqft house run about $200k. The median home is undoubtably smaller and older but this doesn't include land value either. Homes were certainly cheap six years ago.
As far as I can remember the only value in real estate is in the land itself.
Post a Comment