


![[Most Recent Quotes from www.kitco.com]](http://kitconet.com/charts/metals/gold/t24_au_en_usoz_2.gif)
![[Most Recent Quotes from www.kitco.com]](http://kitconet.com/charts/metals/silver/t24_ag_en_usoz_2.gif)
![[Most Recent USD from www.kitco.com]](http://www.weblinks247.com/indexes/idx24_usd_en_2.gif)
Friday Lite
Friday, March 24, 2006
The Iranian oil bourse gets postponed, the reporting of M3 stops, and Ben Bernanke is about to make it through his seventh full week as Fed chief, presiding over a booming economy and a booming stock market with nary a hint of a problem.
Next week, inverted yield curve stress testing begins in earnest - confidence is high that nothing bad will ever happen again.
M3 R.I.P.
Hoping upon hope that Congress would act, data collectors around the world were disappointed to see that the Federal Reserve H.6 report was absent its M3 statistic yesterday. It's now official - M3, rest in peace.
It appears that Rep. Ron Paul of Texas was unsuccessful in his one-man crusade to convince the world that there was value in continuing to report the most complete measure of the supply of U.S. dollars - you have to wonder why he even bothered.March 23, 2006
Recall that the current totals for the three money supply components are as follows, where the M3-M2 has been the fastest growing category, by far, over the last ten years:
H.6 (508)
Discontinuance of M3
As previously announced on November 10, 2005, the Board of Governors ceased publication of the M3 monetary aggregate with today's release. The Board also ceased publishing the following components: large-denomination time deposits, repurchase agreements (RPs), and Eurodollars. The Board will continue to publish institutional money market mutual funds as a memorandum item in this release.
Measures of large-denomination time deposits will continue to be published by the Board in the Flow of Funds Accounts (Z.1 release) on a quarterly basis and in the H.8 release on a weekly basis (for commercial banks).
M3 does not appear to convey any additional information about economic activity that is not already embodied in M2 and has not played a role in the monetary policy process for many years. Consequently, the Board judged that the costs of collecting the underlying data and publishing M3 outweigh the benefits.
To reflect the discontinuance of M3, two sets of historical money stock tables are being published (www.federalreserve.gov/releases/h6/hist/). One set contains historical data related to M1, M2, and their components; this set will be updated each week. The second set contains historical data on M3 and the components of M3 not contained in M2; this set will not be updated.
The final update of the M3 statistic from last week is shown in the chart below. Although we'll never know what the M3-M2 component looks like in the months and years ahead, compared to the previous 20%+ growth rates there doesn't seem to be much out of the ordinary going on here lately - if you consider 15%+ growth rates ordinary, that is.
It's a pretty neat trick when you think about it - how you can have inflation at two, three, or four percent while at the same time having total money supply growing at over eight percent.
Lost in Translation
The China Daily website had a makeover just a few days ago. Now they have a slide show with some pretty cool transitions from one picture to the next in a generally softer looking site.
It's funny when an entire website is changed without notice - you can't remember what the old one looked like, and have to search for an archived article to see what it used to be, since it's way too much work to update all the common html on all the old stuff and it is rarely done, as can be seen from this article from last year.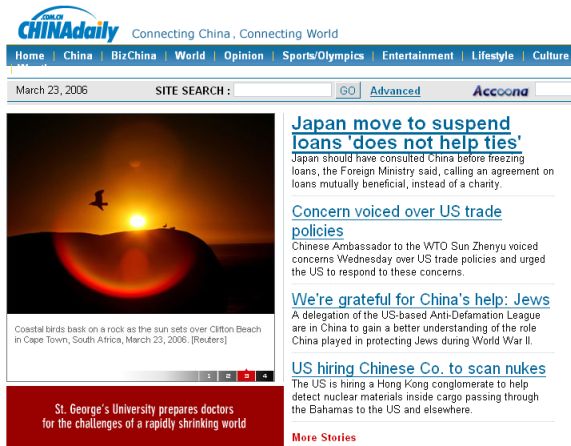
Not sure if it's me or whether the third headline above slipped through the political correctness filter during the translation. It's probably just me, but it does look, well, funny - not something you'd see in a headline in a western paper.
Maverick Thoughts on CEO and Shareholder Interests
Posted as guest commentary at Prudent Bear, where your humble editor's work occasionally appears, Mark Cuban exposes the big lie about what motivates CEOs to do the things they do.There are two types of CEOs, those who are the founders or co-founders of their companies, and those who were hired to do the job. The difference is important because those involved with the founding of their companies not only have a different personal connection with the company and its employees, but more importantly, since they founded the company, they most likely already own a lot of stock. The motivation of a founding CEO will be money, but there will be other considerations. Sometimes.
Mark may be a bit challenged when it comes to gold and the nature of money, but he does seem to understand one of the many fallacies of our "ownership" society.
Then there are those hired to be CEOs. What are the goals of hired CEOs? Plain and simple, its to get paid. To make as big a chunk of money as they possibly can in the shortest amount of time. No one in their right mind is going to take on a job with the amount of pressure, stress and away from family time that comes with being the CEO of a public company without getting paid incredible sums of money.
There is an interesting kinship between hired CEOs and professional athletes. Both realize that there are limited opportunities to make the big financial score, and if they dont make it this time through, they may never get the opportunity again.
There isnt a CEO in America with the opportunity to take the helm of a public corporation that didnt run the numbers in their head and play “what if”. What if the stock went to this price ? What if the stock went to that price? Then based on the total number they needed to get to the networth they always dreamed of, and using the CEO pay totals of men or women who had already done the same thing to get their current jobs as comps, they negotiated their deal from there. Any CEO in this position who tells you otherwise is lying.
Which is why the concept of CEO and shareholders interest being in alignment because they both own stock is a big lie. The CEO wants to hit the homerun of their career when they take the job, the shareholder just doesnt want to strike out with their life savings.
Southpaw Snails
Wouldn't it be fun to have a job where you study nearly 2,000 snail fossils and draw a bold conclusion that then makes it onto the front page of Yahoo!, and then you call all your friends and family and say, "Check out the front page of Yahoo! - they're talking about my snail research."
That happened yesterday, well, at least the part about Yahoo! story.Left-handed snails are better than righties at defending against predators, according to a new study that suggests lefties have the same competitive advantage in nature that they enjoy on the baseball diamond or in the boxing ring.
The researchers probably didn't look up any statistics before citing the baseball analogy (nor did we here, for that matter), but it seems that the further up you go in baseball ranks, the more lefties there are. There seem to be an unusually large number of left handed baseball players in professional baseball, something fairly unique to the sport, and this is likely a result of factors cited in the snail report above. The study, published in this month's Royal Society Biology Letters, suggests that snails whose shells coil toward the left were more likely to survive crab attacks than those whose shells coil toward the right.
"It's just a frequency issue," said Yale geologist Gregory P. Dietl, one of the study's authors. "As long as you're rare, you're going to have an advantage."
The researchers studied about 1,800 snail fossils, looking for scarring evidence of a predator attack. Scarring was found more frequently on right-handed snails, the study said.
Researchers offered two explanations for the advantage. Because most crabs are right-handed, they said, cracking into a shell that opens on the opposite side might be more difficult.
Alternatively, researchers said crabs might simply not be used to attacking lefties, just as baseball pitchers face fewer left-handed batters.
"It's the same thing here in nature," Dietl said. "These snails that are left-handed, they have an advantage. It doesn't become an advantage if lefties are just as common as righties."
All through little league, it would appear that left-handers have an inherent advantage, where, at a young age everyone is playing the sport, and the normal 10 percent rule applies. All else being equal, lefties have this unfamiliarity advantage.
When you continue your baseball playing career, you meet up with all the other lefties who have had this advantage in their formative years, and voila!, you have an unusually high percentage of left-handers in professional baseball relative to the population as a whole.
Thus concludes our amateur geology/sports/biology lesson for the week.

4 comments:
sweet science project. but I am sure definition of a leftie is quite lofty. Strong survivers are more adaptative. Ie. good basketball players can shoot with left and right hand. Thus quite often misclassifed by a casual observer.
--
"The median sales price fell by 2.9% year-over-year to $230,400 in February. The average sales price rose 2.6% to $296,700" CBSmktw.
Looks like the lows are going lower, and highs are going higher.
Booming Economy and Stock Market bahahahaha. Hardly. Classic Macro mistake.
I downloaded the M3 numbers a while ago and took a look at yr-to-yr growth rates, and on my chart the rate rarely goes over 10% at any point since about 1987. Are we getting our numbers from the same place?
My own little pet theory is that the so-called credit derivatives market is going to be the next 1987/Long Term Capital Management/Asian Currency/Dotcom crash (as opposed to the housing crash that everyone's expecting). The theory goes that every time we have a crisis the Fed pumps a lot of money and it's averted (or postponed). Conventional wisdom is that the money goes from, eg, dotcom stocks to houses to ... what is the next asset to go through the roof because of Fed intervention?
The numbers (for M3 at least) just don't seem to bear this out -- no apparent correlation between money growth and Time of Crisis.
As for the M3 growth rate, whatever it may be, don't forget to take into account the growth rate of real GDP. At recent growth rates, money can grow at 4% a year without growing in proportion to real production. Hence, recent money growth rates of about 8% might be consistent with inflation of around 4%, which is not great but still pretty tame compared to the old days (1970s).
Interesting blog, BTW - Thx!
Econoclast,
If you are looking at M3, then you are correct. What I was referring to was the M3-M2 component which is no longer available as a result of disconinuing M3. There does seem to be a bit of a correlation between M3-M2 growth and LTCM and Y2K.
Post a Comment