


![[Most Recent Quotes from www.kitco.com]](https://lh3.googleusercontent.com/blogger_img_proxy/AEn0k_tDnixWkny6TJorTrroevw1FwzWjYuyolQAdzYRLi-pm7odMi-YA3s1gRBxIYfOadB8n-Gs1UdvRTlGezA_itmispnpuAhtrqn-iQgLeFxvaPFxMEjMzWThPOvu7f6W=s0-d)
![[Most Recent Quotes from www.kitco.com]](https://lh3.googleusercontent.com/blogger_img_proxy/AEn0k_vkYnK2aVyVYiKG7-HMBuYKAgAQS0aaG-nueGB7FblAzyKp3ositHdmwk9CxmIeAyLv-IZft98lXRvzgGZFEEPxyichz1M8ehbD48bRpSr8bfSXzKk4U3r2_xaBbyA3p_Y=s0-d)
![[Most Recent USD from www.kitco.com]](https://lh3.googleusercontent.com/blogger_img_proxy/AEn0k_sf_c6UaVsFnvUUEGuUYARu7HS_tjAQ0vk5RNe3S07Ar0jCFQL0gjJlLNyjaM8VfgcAfJVAgkC6IQmVGXzaVtLfvtXzqruhJVCkgVSJVRpcUY0ldcQIHdhh=s0-d)


Non-inflationary Growth It Isn't
Thursday, January 26, 2006
For those wondering what Alan Greenspan's gift to the world is, rest assured, non-inflationary growth it is not. Growth has been anything but non-inflationary in recent years, but then, it all really depends on how you define inflation.
While the phrase seems to roll off the tongues of supply-siders almost as easily as "tax cuts", the words "non-inflationary growth" seem to be falling on the deaf ears of much of the middle class and many senior citizens.
The White House appears to be confused by two conflicting sets of data - economic statistics showing that all is well, juxtaposed with polling data indicating that people are not happy with the economy, or the management thereof.
This topic was addressed here a short time ago in Fool Me Twice...
While conservative lawmakers and pundits urge the White House to trumpet robust economic growth with nary a whiff of inflation, political strategists urge caution knowing that GDP means little to those who, today, struggle to make ends meet, and in November will cast ballots.
The chart below shows what policymakers and monetary authorities would like people to think of when they think of inflation - the operative word is benign. After a decade of wild price increases in the 1970s, inflation has been tamed, and that's just the way it is.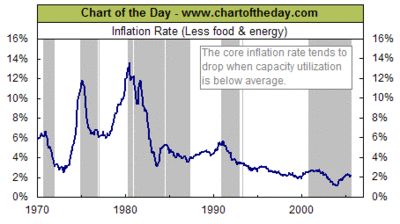 While the non-inflationary growth story may be a hit on Wall Street, it is receiving poor reviews on Main Street.
Having poked at the raw data for nearly a year now and having seen how it is cajoled and prodded to answer two percent when queried for the monthly increase in prices, it is clear that the reporting of inflation is the biggest fraud perpetrated on the American people since the mysterious decoder ring in A Christmas Story yielded the disappointing secret, "Be sure to eat your Ovaltine".
For the best example of how non-inflationary growth has been anything but non-inflationary, recall the announcements from last fall when Social Security recipients were informed of their cost of living increase and new Medicare insurance premiums were revealed.
The Kaiser Family Foundation has a summary here - the math isn't that complicated:
However you look at it, it's not good.
Other issues related to the underreporting of rising medical costs in government inflation statistics were covered in detail last fall - Open Enrollment and the CPI - Part One and Open Enrollment and the CPI - Part Two
Yes, productivity has improved around the world and there is excess capacity in Asia, but two important changes have occurred in the last twenty years that make the above chart very misleading - changes to the calculation of inflation and the importing of low-cost goods from around the world, most notably Asia.
From Home Ownership Costs and Core Inflation last year, the chart below shows the impact of having removed home prices from the consumer price index in 1983. In the last few years, as home prices have become completely disconnected from rental costs, reported inflation seems ridiculous.
Click to enlarge
While it is true that real estate is an asset, it is also a cost that is paid by consumers. It is affected by many variables, but when you think about it, it shares many qualities with durable goods - purchased infrequently and paid for over time. Using the rise in real estate prices instead of the rent substitute, consumer prices come out roughly three points higher than that reported by the BLS.
Quality adjustments also put downward pressure on prices - this began in a big way in the 1990s when claims of "inflation is overstated" were being tossed around Washington as congressmen grappled with cost-of-living increases for Social Security recipients.
While quality improvements should be considered when calculating price increases, because a washing machine has more knobs and buzzers does not necessarily mean that it is any better if all you want to do is wash your jeans.
The biggest factor in reportedly Benign Inflation in recent decades has everything to do with low-cost goods imported from Asia. These falling prices (think Wal*Mart) have done a neat job of offsetting rising costs for services in America.
The chart below tells this story for the recreation category within the CPI - falling prices for imported goods offset price increases for U.S. based services. Not surprisingly, the overall rise in prices for this category is, on average, about two percent a year (a seemingly magical number - Two Percent Inflation).
Click to enlarge
When your trading partner has lower production costs and you amass huge trade deficits because you import so many of their goods, currencies are supposed to adjust (causing upward pressure on the price of imported goods) to balance the currency-trade relationship.
When this rebalancing does not occur, prices stay low while trade deficits mount.
That is exactly the situation in world trade today - low price pressure from Asia that U.S. policymakers take full credit for, while at the same time repeatedly asking China to revalue their currency to quell the fears of a labor market that continues to hemorrhage manufacturing jobs.
And, now white-collar jobs too.
No, non-inflationary growth is not Alan Greenspan's gift to the world.

7 comments:
They can't even stand to report Core CPI at 2.5% and have taken steps to adjust Core CPI down:
"Next month, the Bureau of Labor Statistics will update the market basket on which they compute CPI changes."
January 18, 2006
~ Michael F. Bryan
For a refreshing change, the December CPI report had a bit of good news this morning for both consumers and inflation worry-warts like me. For consumers, many of the items that posted price declines in November continued to do so in December, including energy, men’s apparel, footwear, and new and used vehicles. To these were added falling prices on women’s apparel, beverages, dairy products, and bakery goods. In fact, when you add them up (and I did), 35 percent of the consumer’s market basket showed either no change or a price decline last month, compared with about 25 percent a month earlier. Likewise, only a little more than 13 percent of the CPI basket posted price hikes in excess of 5 percent (annualized) in December, compared with about 24 percent in November. So whatever sleep I lost in the days immediately following the November CPI report, I hope to recoup starting this evening.
Sure, the “core” measures of inflation, reported in the following table, weren’t great, but they certainly didn’t worsen, seeming content to remain in the neighborhood of 2 to 2½ percent. (More detail can be found in the Cleveland Fed’s median CPI press release.) Any whiff in the November data that prices were poised to break the upper 2½ percent threshold seems to have vanished in December.
Now, if you’re like me, you might be more comfortable if the CPI trend was closer to the lower end of that 2- to 2 1/2-percent range. Well, we might be getting some help from the BLS beginning with next month’s CPI report.
Here’s a puzzle for you: If a good’s price goes up, and you don’t buy it, has your cost of living risen? [Actually, this is a question that most economics majors are asked on an examination at some point in their undergraduate studies.] The intent of the question is to get students to think about the theoretical difficulty of measuring changes to our cost of living. Here are two rules in measuring cost of living, and if they seem in conflict, well, that’s because they are. Rule one: When you gauge price changes, you must fix the market basket. One can’t make any conclusion about the cost of living by comparing the price of the oranges I bought yesterday to the price of apples I bought today. And rule two: Once you fix the market basket, it immediately becomes outdated!
It turns out that there is no right answer to the question above. You can either price the oranges you don’t buy today, or the apples you didn’t buy yesterday. Most economists have concluded that it’s most useful to value the items you bought in an earlier period using the prices of today—as long as that earlier period wasn’t too long ago. Next month, the Bureau of Labor Statistics will update the market basket on which they compute CPI changes. The basket will reflect consumer expenditure patterns over the 2003-2004 period, compared to the 2001-2002 basket of goods they use today. Can the market basket really change that much in just a few years and, moreover, is it likely that the new market basket give us a higher or lower reading? Well, yes, the market basket can change quite a lot. And I’m not just thinking about ipods, Xboxes, and high-definition TVs. Whenever prices move, people change their expenditure patterns—generally moving away from the goods going up in price in favor of goods where prices are relatively more favorable. So yes, we can anticipate that when the market basket is updated, changes in the cost of living will be more moderate than they would have otherwise been. How big a change is this likely to be? We’ll know next month. But to give you an idea, consider the figure here, which compares the “core” CPI to the “core” CPI on a chain-weighted basis.
Chained_cpi
The chain-weighted CPI is an experimental measure which updates the consumer market basket more frequently that the conventional CPI. Over time, the chained CPI has averaged about 4/10ths of a percentage point below the conventional measure, an indication that updating the basket could have a significant effect on our CPI reading. So, if you are like me, and would like to see the CPI trend closer to 2 percent than 2 ½ percent—the BLS might just have what you are looking for in next month’s report.
http://macroblog.typepad.com/macroblog/2006/01/dont_like_the_c.html
Repeat after me; 2% inflation...5% unemploment... repeat...repeat...repeat
Why not rename CPI to TPI -- the "two percent indicator". Then you can cut out the largest part of the surveying bureaucracy and keep only the secretary who issues the monthly report, further "reducing the size of government".
Gosh, if I didn't know better, I'd say that the CPI vs. Home Prices chart shows that a housing price inflation is always followed soon after (1-4 years) by a CPI jump of similar magnitude.
And if I didn't know better, I'd say it looks like we've just started the CPI climb from the start of the most recent upward-leg of our current housing bubble.
If I didn't know better, I'd be getting my money the hell out of dollars.
Now that housing prices have hit all time highs, wouldn't it be just the time to revert to old method? Then we could all watch while the CPI goes negative.
on another inflationary note. this past week, we've had a berdanke party.
short bond yields are down. long bond yields up. energy corps (up 11% ytd, mining corps (13% ytd), and reits (6% ytd)
looks like insiders think bernadke may break status-quo, and may actually not raise rates.
I'm in the camp that the rates will not be raised next week, especially after the troublesome GDP report today.
The rate is now what, 4.25? IMO it should be closer to 6% but the time to do major increases is 12 months behind us. Now we will have to clean up this mess that could have been prevented a long time ago.
I lean toward the view that, although there are inflationary pressures in commodities, factory usage, etc, that there are more factors that point to deflation, or possible deflation. Those include the housing bubble crash, tightening of credit, worldwide price competition, outsourcing and chinese cars. Yup, Chinese cars. We need em.
Post a Comment