A Noticeable Deceleration
Thursday, June 16, 2005
Dataquick reports monthly home sales information for northern and southern California, as well as a number of other regions throughout the country. They provide a great deal of valuable information for anyone trying to make sense of home sales trends in these regions - it's all right there on their website for anyone to dig into.
When the Southern California home sales figures for May were released yesterday, many sphincters in the Southland must have tightened up - at least a little bit. Worst fears of a housing bust are a long ways from being confirmed, but the change in trend in some areas is ominous - at least a little ominous.
All this talk about housing bubbles may have finally worked it's way into the heads of people who were actually thinking about buying $600K condos like this. Although, in fairness, the public transportation does appear to be quite convenient.
The news wasn't that bad on the surface. In fact another high was reached for median home price in Southern California - $456,000, up from $445,000 the previous month, and up 15.2 percent from $396,000 for May 2004.
But, it seems that even the headline writers have been worn down by all the bubble talk - "Southland Real Estate Market Eases Back" is how Dataquick titled the data release, and the normally unflappable San Diego Union Tribune proclaimed "Annual appreciation rate under 10% for first time since December 1999". Perhaps they now grudgingly accept the real possibility that prices will not continue to increase at the pace to which they have become accustomed.
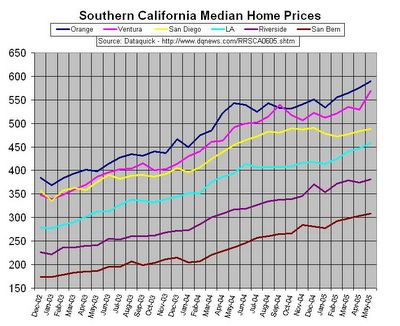
Let's take a look at the new numbers along with a bunch of older numbers:
Click to Enlarge
Well, that doesn't look too bad. Things are still headed in the right direction and Ventura County seems to have popped up rather nicely in May. Although it did pop up like that eight months ago only to pop back down the next month - we'll see. Most of the other counties have a nice four-month trend going, but that yellow line has a curious shape.
Overall, there doesn't appear to be much to worry about ... unless you look at the data this way:
Click to Enlarge
Now there appear to be a few trends here that don't look so good - if you've got a Condo to flip in San Diego, after one look at that yellow line it should be clear that this trend may NOT be your friend! In fact, maybe the folks at the Union Tribune worked up a similar chart, looked at that yellow line, and then decided on what kind of headline to write.
The rate of change of the year-over-year price change (i.e., the slope of the curves above) is similar to the acceleration of a body in motion - acceleration is the rate of change of a moving body's velocity. Galileo conducted many experiments and made many observations pertaining to gravity, velocity, and acceleration. One of the most famous ones is known as Galileo's Ship, where it was noted that an individual below deck on a large moving ship had no idea how fast the ship was traveling (this already sounds like the Southern California housing market).
It was observed that with no external reference, as long as the ship was moving at a constant velocity, everything seemed normal - it didn't matter how fast the ship was moving, just that the speed did not change. Fish in a fishbowl swam about effortlessly, butterflies flew indifferently from one side of the cabin to the other, and one could walk about the cabin as if the ship were standing still.
It was not until the ship accelerated or decelerated that butterflies began to fly erratically, fish now had to swim just to maintain their position within the bowl, and walking about the cabin became dangerous.
Think of the constant speed as the 20%-25% per year home price increases to which Californians have become accustomed in recent years. Perhaps San Diego real estate speculators will notice the deceleration so evident in the yellow line above and go above deck to take a look around - if they can walk steadily enough.


![[Most Recent Quotes from www.kitco.com]](http://kitconet.com/charts/metals/gold/t24_au_en_usoz_2.gif)
![[Most Recent Quotes from www.kitco.com]](http://kitconet.com/charts/metals/silver/t24_ag_en_usoz_2.gif)
![[Most Recent USD from www.kitco.com]](http://www.weblinks247.com/indexes/idx24_usd_en_2.gif)

0 comments:
Post a Comment