The "Real" Reagan Revolution
Wednesday, June 15, 2005
There is a veritable treasure trove of data available at the Federal Reserve - G.19 Consumer Credit, Z.1 Flow of Funds, G.17 Industrial Production and Capacity Utilization, H.3 Aggregate Reserves of Depository Institutions and the Monetary Base to name a few. There are twelve Federal Reserve Districts in all, each with their own sets of economic research and data. Wading through these reports, surveys, and statistical releases can strain the eyes and numb the mind - but the data does have a story to tell.
The problem is that the data is confined to a tabular existence. Very few charts or graphs are available - just tables, lots of them, with row after row and column after column of numbers. And, no commentary - lots of footnotes and dry explanations as to how the numbers were obtained or what the numbers include or exclude, but no clues as to what the data means. No grand conclusions or bold predictions about what the data is saying, apparently that job is left to economists and other bored or demented souls who enjoy this sort of thing.
Today, in an attempt to begin the process of releasing this data from the shackles that bind it, we take our first plunge into Federal Reserve data. Our goal is to allow the data to tell it's story ... and if it isn’t talking we'll make something up.
Rising Consumer Credit
Let's dig a little deeper and try to understand what we stumbled across the other day and termed the "real revolution" that Reagan started. If you'll recall, there was a chart of Total American Debt and National Income since the 1950s. In this chart, there was a clearly indicated change in trend during the early 1980s where debt growth and income growth diverged.
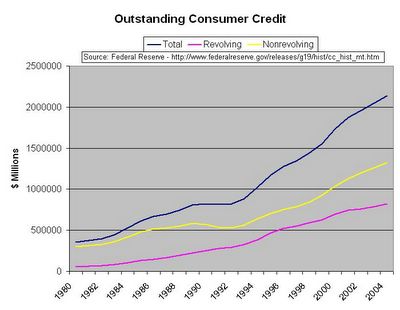
A large component of the Total American Debt is consumer debt, which includes revolving debt such as credit cards and non-revolving debt such as auto loans, but which does not include mortgage debt (we'll save that for another day). Looking at outstanding consumer credit since the early eighties, it is clear that in the last few decades, Americans have developed an ever-increasing appetite for more and more debt.
Outstanding consumer credit has more than quadrupled since 1980. It took ten years to double between 1980 and 1990, then paused during the early 1990s recession, then resumed with a much steeper slope taking only seven years to double again between 1993 and 2000. In recent years, there has been a slight leveling off, due, in large part, to home equity lines of credit fulfilling the role previously the domain of revolving and non-revolving consumer credit.
Consumer credit can be thought of as a sort of marijuana phase - a "gateway" drug. A gateway drug that eventually led to home equity lines of credit and interest only mortgages, which can be thought of as a much worse drug, with more powerful effects.
[By the way, there is an excellent documentary on PBS Frontline, available for viewing online - The Secret History of the Credit Card. If you have not already seen this, it is highly recommended.]
Level Debt Service Ratios
How is it that American consumers can handle such an increasing debt load? According to the Census Bureau Historical Income Data, median incomes have not gone up at nearly this rate, and the new jobs that have been created in the last ten years don't pay what the millions of lost manufacturing jobs used to pay. Americans borrow more and more money to buy more and more goods and services, all in an effort to constantly increase their standard of living, to have more "stuff", but how do they pay for it?
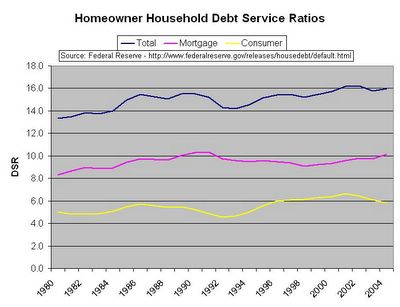
The answer is clear when looking at the Debt Service Ratios since 1980.
These curves are flat!
Well, pretty much flat - a lot flatter than curves on the chart of outstanding consumer credit. Somehow, Americans are able to increase their borrowing at a much higher rate than their incomes rise, but yet the percentage of their income to service that debt remains fairly constant.
A good example of this phenomenon is today's real estate market - with the same monthly payment of five or ten years ago, a much larger mortgage can be obtained today.
Declining Interest Rates
A large part of the explanation as to why individuals can take on more and more debt without attendant increases in income comes from the twenty-year decline in interest rates. This is the "real revolution" that Reagan started - for the next twenty-some years, keep borrowing more and more money while interest rates steadily declined. As long as interest rates continued their move down, individuals, corporations, and federal, state, and local governments could all increase borrowing, without increasing the cost of servicing the debt.
Not coincidentally, the point in time when interest rates first began their march toward zero denotes the beginning of the greatest bull market in stocks that the world has ever witnessed. This was then followed by one of the mildest recessions in history in 2001, which was then followed by the biggest housing boom in history.
All during this time, interest rates continued to steadily decrease, and money became cheaper and easier to borrow.
Unfortunately, it looks like we're about to hit bottom. It's not clear what the plan will be going forward - the tick up in interest rates over the last year could cause some difficulties in servicing all this accumulated degbt.
In a few years, maybe the Federal Reserve will have to start paying people to borrow money if this revolution is to continue.


![[Most Recent Quotes from www.kitco.com]](http://kitconet.com/charts/metals/gold/t24_au_en_usoz_2.gif)
![[Most Recent Quotes from www.kitco.com]](http://kitconet.com/charts/metals/silver/t24_ag_en_usoz_2.gif)
![[Most Recent USD from www.kitco.com]](http://www.weblinks247.com/indexes/idx24_usd_en_2.gif)

3 comments:
Wow. Lovely work. Your blog is definitely getting a link from mine.
bubblemeter.blogspot.com
isn't it interesting that there is no such thing as abalance sheet of the Fed itself!?!?
You can thank professor Laffer, hero of the "new economy." Recall his famous curve, drawn on a napkin, showing how tax cuts were self-funding. And his theory did work. But like all economists trained in that era, he assumed a closed economy i.e. the US economy worked in isolation. In practice, the demand created the US tax cuts was filled by imports... and the tax revenues went to foreign governments not the US Treasury. They got the profits and the tax revenue, we got the debt.
Post a Comment