All Eyes on San Diego
Tuesday, July 19, 2005
This is the last time we'll mention San Diego for a while - houses, construction jobs, restaurant jobs - after today that's it for a while. Fed Chairman Alan Greenspan goes to Capitol Hill tomorrow for his final group therapy session with Congress, and that should result in plenty of things to talk about - things that the mainstream media picks up on and things that they miss.
But, in the mean time ... the monthly Dataquick report for Southern California real estate was released yesterday. It was a generally positive report, especially for the inland counties of San Bernardino and Riverside (not sure why they call it the Inland Empire - it's hard to imagine an "empire" in an area that was just cactus and tumbleweeds fifty years ago).
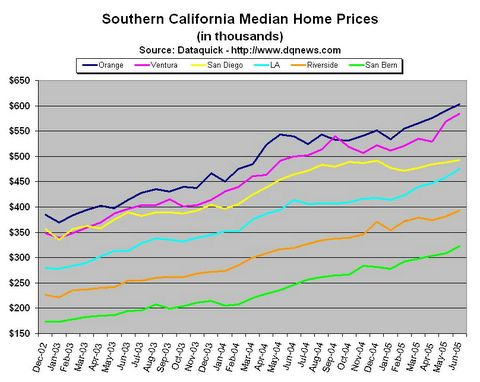
Anyway, the major trends that have been in place continue - inland, lower cost areas are still experiencing good month-to-month and year-over-year appreciation, while growth in the more mature bubble areas slows. Looking at the median prices over the last couple years, prices in San Diego county have clearly moderated over the last year, and in Orange and Ventura counties, after slowing six or eight months ago, there is a new surge in prices in recent months.
Click to enlarge
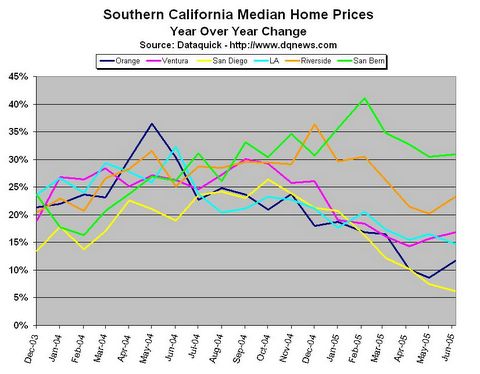
As noted last month, the longer term trends become much clearer when looking at the year-over-year price changes for each county over time. San Bernardino and Riverside prices have risen at a rate of 20%+ for the last year, while other counties have not experienced this rate of appreciation since the end of last year.
Click to enlarge
Again, that yellow line representing San Diego is the most intriguing of all lines - eight months of falling year-over-year price increases (from 26% last October to 6% in June). Still positive, but certainly not the trend that many were looking for, say, a year ago. Even more intriguing will be the year-over-year comparisons starting in August and then again in November, the 2004 price peaks in San Diego.
The next chart is the volume for all the Southern California counties - not that interesting really, and a bit confusing because of the seasonal variations, however it does clearly show the relative number of the sales for each county and the extreme seasonal nature of real estate sales volume.
Click to enlarge
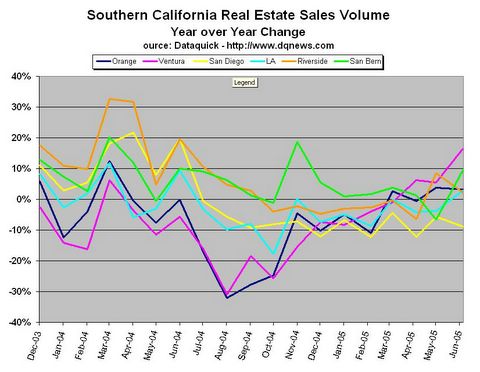
The year-over-year version of the sale volume chart does, however, contain some interesting data. First, by doing the year-over-year comparisons, the chart becomes seasonally adjusted, which makes it much easier to spot trends. And, of course, the most significant trend is, again, the yellow line.
Click to enlarge
While home sales in San Bernardino and Riverside are strong and consistent, both Orange and Ventura counties seem to have carved out a sales volume bottom in late 2004 (largely a result of comparisons to extraordinary 2003 summer sales volume) and rebounded nicely over the last nine months.
In San Diego, however, the year-over-year sales volume seems to have gotten stuck in the -5% to -12% range for the better part of a year. This can't be a good sign.
In the northeast, areas such as Boston are showing the same pattern as currently exists in San Diego - consistently fewer sales year-over-year to go along with moderating year-over-year price increases solidly into the single digits for the first time in many years.
The San Diego housing market will be interesting to watch.


![[Most Recent Quotes from www.kitco.com]](http://kitconet.com/charts/metals/gold/t24_au_en_usoz_2.gif)
![[Most Recent Quotes from www.kitco.com]](http://kitconet.com/charts/metals/silver/t24_ag_en_usoz_2.gif)
![[Most Recent USD from www.kitco.com]](http://www.weblinks247.com/indexes/idx24_usd_en_2.gif)

4 comments:
re San Diego:
How is the property tax structure different from other areas of CA? Are their impediments to sales? I was there a couple of years ago and someone told me that if were in your owner-occupied house for a number of years, you had to be nuts to sell because some sort of draconian property tax revaluation kicks when a house is sold (and you have to, presumably, buy another).
Do I have this right?
No proposition during the last twenty years has affected Californians as much as Proposition 13. It was passed in 1978 during a recessionary period when inflation was high and property values were soaring. With high property values the property taxes rose proportionally. However, for many elderly homeowners who were living on fixed income, the increased property taxes were something they could ill afford. As a result, Prop. 13 proposed capping property taxes at 1% of the properties' assessed value, down from the original 2 or 3%. It also capped how much property taxes could be raised each year.
http://en.wikipedia.org/wiki/California_Proposition_13_(1978)
To more specifically answer the first poster's question:
Under proposition 13, the property tax assessment is set at the fair market value of a home at the time of sale, that is in 99% of the cases, the sale price. The base tax is 1 percent of the assessed value, with local governments allowed to add additional surcharges and fees which usually come to another 1 percent or so.
After the initial sale, the assessed value of the house may increase by no more than 2 percent per year -- until, that is, the next sale, at which point the property is completely re-assessed at the fair market value (sale price).
Some people think this is unfair because two people, in identical houses right next to each other, may pay radically different property taxes.
However, as a Southern California homeowner who has owned a home for 16 years, I can say that there is a sense of justice, when viewed over time. Yes, my taxes were the highest in the neighborhood in the beginning. Now, however, thanks to the bubble, our taxes are among the lowest, and the people down the street who recently bought are getting hosed. In time, as inflation marches ever upward, they, too, will see the benefits of proposition 13.
In addition, proposition 13 provides an extremely valuable predictability to the likely future rate of increase in property taxes, something which would not be possible if the "injustice" of identical properties being taxed differently referred to above were abolished and properties were re-assessed annually.
So, yes, someone who has owned a home for a long time would be crazy to sell if he or she didn't need to. In my case, were I to sell my home and buy an equivalent one, my taxes alone would go from about $450 a month to at least $1000 a month.
Finally, as someone who grew up in Redlands, California, let me say that, 50 years ago, the Inland Empire was orange groves and stately Victorian mansions with a few small town shops and houses thrown in, not cactus and sage brush.
I stand corrected on the Inland Empire tumbleweed comment.
Post a Comment