


![[Most Recent Quotes from www.kitco.com]](http://kitconet.com/charts/metals/gold/t24_au_en_usoz_2.gif)
![[Most Recent Quotes from www.kitco.com]](http://kitconet.com/charts/metals/silver/t24_ag_en_usoz_2.gif)
![[Most Recent USD from www.kitco.com]](http://www.weblinks247.com/indexes/idx24_usd_en_2.gif)
One Last Look at the Jobs Data
Tuesday, August 09, 2005
This will be the last of the jobs data for a while - an FOMC announcement is due today, then later in the week the Treasury Budget and Trade Balance numbers will print. Some or all of these are bound to provide some kind of excitement and should sufficiently divert our attention from the historical jobs data with which we have been preoccupied lately.
[This look into the historical jobs data has been kind of like driving by an automobile accident. Having slowed down to see what happened, we now find ourselves at almost a complete stop, unaware of horns honking from behind, as we stare, mesmerized, unable to avert our gaze.]
Today it's the services jobs we are interested in and we go back to 1991. The question we will attempt to answer is, "How does the recent creation of Professional and Business Services jobs compare to other periods since the early 1990s recession?" The answer, surprisingly, is not as bad as we initially thought, however, this is only because recent work in this area has caused expectations to be set very low.
Wishful Thinking
The wishful thinking here is that since many manufacturing jobs have been lost in recent years, that maybe, somehow, this is being compensated for by an increasing number of higher paying services jobs. First we look at the changes to Professional and Business Services jobs by category, in two year intervals from 1991 to present.
Click to enlarge
The first thing that grabs the eye are those orange bars hanging down from the zero mark on the x axis - they stand out like sore thumbs. The years 2001 to 2003 were not very good years for services jobs, or for most other jobs either, as we'll see a bit later. In fact the job loss from 2001 to 2003 is quite dramatic compared to the last downturn in the early 1990s.
It's hard to believe that with all these job losses from 2001 to 2003 we had such a mild recession. Or, stated another way, it's hard to believe that such a mild recession could have resulted in so many job losses.
There were officially three quarters of negative GDP growth - Q3-2000 and Q1-2001 with -0.5% and Q3-2001 with -1.4%. By comparison, during the early 1990s, there were 2 quarters of negative GDP growth - Q4-1990 with -2.0% and Q1-1991 with -3.0%. This early 1990s period looks rather tame from a job loss perspective compared to the 2001 to 2003 period (Note: this BLS data series stops in 1990 or we'd go back another two years and show 1989 to 1991 - jobs were basically flat from mid 1989 to mid 1991).
So, ignoring 2001 to 2003, how does the Professional and Business Services job creation over the last two years stack up against that of the 1990s? Nothing special, really.
Across all these categories, job creation during 2003 to 2005 was roughly equivalent to the average job creation for the 1990s.
But, On a Percent Change Basis ...
One thing to keep in mind is that over this fourteen year period, the jobs base has grown - by almost 50 percent in this sector. For example, there were 916,000 Architectural and Engineering jobs in 1991, but 1.33 million in 2005. So, the creation of say, 60,000 jobs from 1993 to 1995 is much more significant, on a percentage basis, than that same number of jobs a decade later.
When viewing the above chart on a percent change basis, recent job creation for Professional and Business Services doesn't look nearly as good as it did initially.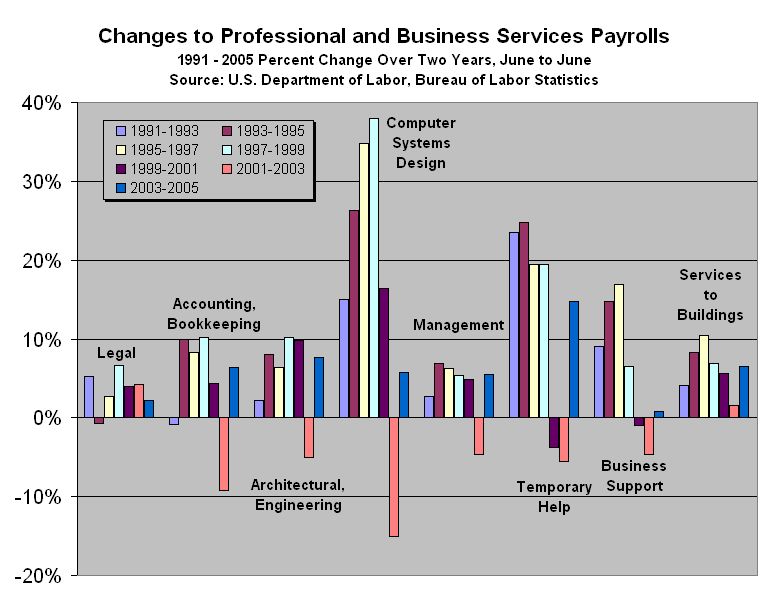
Click to enlarge
In fact, in this chart, Professional and Business Services job creation appears to be no better than the 1991 to 1993 period. That's kind of disappointing - in half the categories the services job creation of the last two years exceeded that of the jobless recovery of the early 1990s, and in the other half of the categories, it was worse.
The Big Picture
So what does all this mean? Professional and Business Services job creation was a disaster from 2001 to 2003, and it has been no better over the last two years than it was during the 1990s. As sadly depicted in the chart below which includes all major categories of employment in the U.S. over the last fourteen years, it appears that in the last few years, millions of manufacturing jobs have been lost, and that's the end of the story.
There has been no substantive difference in any of the other sectors to compensate for the manufacturing jobs loss.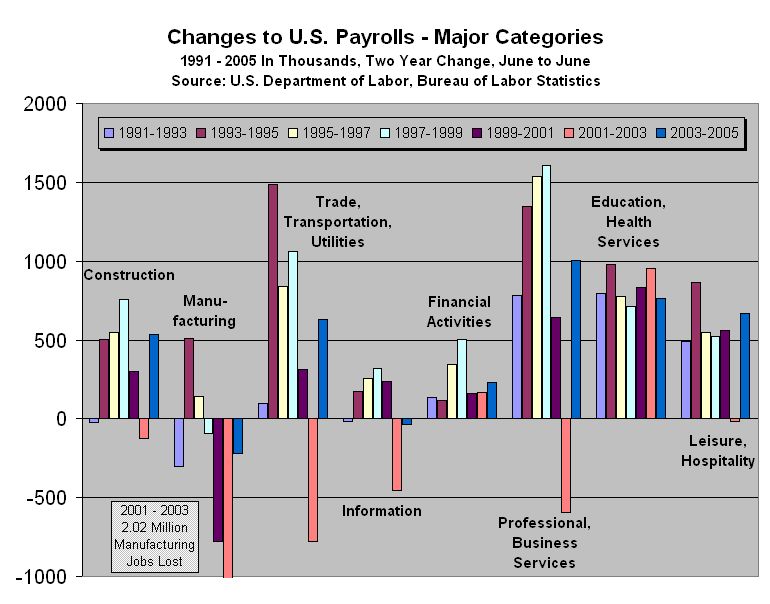
Click to enlarge
How can the citizenry continue to spend and consume as they have, and how can growth be as robust as it has been over the last few years? With this sort of labor picture?
The answer surely lies in the the real estate bubble, the wealth effect it has engendered, and the astronomical debt levels which Americans now seem to accept as part of their lives.

2 comments:
Thanks for the kind words Deb.
Show me the money...
Post a Comment