


![[Most Recent Quotes from www.kitco.com]](http://kitconet.com/charts/metals/gold/t24_au_en_usoz_2.gif)
![[Most Recent Quotes from www.kitco.com]](http://kitconet.com/charts/metals/silver/t24_ag_en_usoz_2.gif)
![[Most Recent USD from www.kitco.com]](http://www.weblinks247.com/indexes/idx24_usd_en_2.gif)
Money Isn't Everything
Friday, December 09, 2005
Since 1990, the United Nations has published a Human Development Index (HDI) which attempts to measure the general "well-being" of people in countries around the world. The index consists of measures for longevity and education in addition to economic well-being as represented by gross domestic product (GDP) per capita using purchasing power parity (PPP) for exchange rate adjustments.
In light of all the national attention given to last week's robust GDP growth in the U.S., and ongoing scrutiny of said growth here and here, an exploration of alternative measures of "well-being" seemed to be an appropriate diversion today.
The chart below, from the 2005 Human Development Report, shows the top twenty countries ranked by their HDI value, with detailed data for the three equal weight components - life expectancy (columns 3 and 5), education (column 6), and GDP per capita (columns 4 and 7).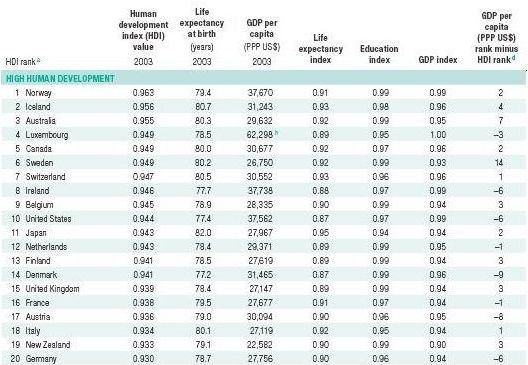
Not surprisingly, the U.S. ranks very high in per capita GDP, but comparatively lower ratings for longevity and education result in an overall ranking of tenth place, behind Norway, Australia, Canada, and six other countries.
The rightmost column is of particular interest - it is a measure of how much higher a country's HDI rank is than their GDP rank. A positive number indicates relatively better longevity and education compared to GDP per capita - more "bang for the buck", so to speak. A negative number indicates the opposite - despite comparatively good output, longevity and education lag.
Of the top 57 countries deemed "high human development" in the report, the countries with the highest positive numbers are:
The countries with the lowest negative numbers are:
What does this mean? Well, if all the data is correct, it means that high consumption does not necessarily go hand-in-hand with living longer healthier lives and having a better educational system.
Life Expectancy
The longevity statistic seems to be pretty straightforward - minimal record keeping should be required to produce meaningful sets of data, and this shouldn't be too controversial.
There appears to be a great disparity in life expectancy in different parts of the world, surely for many different reasons. The OECD countries lead the way by a wide margin - this is basically the entire "Western" world, including most of Europe, North America, Japan, Australia, and New Zealand.
The spread of HIV/AIDS in Africa is clear from this chart, and there appears to be a longevity crisis in the Commonwealth of Independent States (CIS) as well.
Within the eleven former Soviet republics, with no major wars, famines, or health crises there has been a precipitous decline in life spans. In 2003 life expectancy was 59 years for Russian men and 72 years for women, one of the widest gender gaps in the world.
This is attributed in large part to alcohol consumption and alcohol-related illness along with an increase in violent crime resulting in part from the disintegration of law and order, as much of the former Soviet Union continues to grapple with reforms.
Education
The education category consists of two parts - adult literacy and enrollment in schools. Adult literacy rates are determined by data collection during national population censuses, usually every five to ten years, however in most Western countries with high levels of literacy, this data is no longer collected and a 99 percent literacy rate is used instead.
The enrollment rates are determined by the combined gross enrollment ratio for primary, secondary and tertiary schools, where the ratios are calculated by dividing the number of students enrolled in all levels of schooling by the total population in the age group corresponding to these levels. The quality of education and the educational level attained by students are not reflected in the enrollment measure, simply how many are attending school.
[This report is filled with fascinating data - this post will be continued over the weekend.]

2 comments:
I always thought those Scandanavian countries knew something that the rest of us didn't - Iceland - there must be something in the water.
...or better- nothing in the water.
Post a Comment