


![[Most Recent Quotes from www.kitco.com]](http://kitconet.com/charts/metals/gold/t24_au_en_usoz_2.gif)
![[Most Recent Quotes from www.kitco.com]](http://kitconet.com/charts/metals/silver/t24_ag_en_usoz_2.gif)
![[Most Recent USD from www.kitco.com]](http://www.weblinks247.com/indexes/idx24_usd_en_2.gif)
More Questions About GDP
Thursday, December 08, 2005
Last week, in a first look into some of the details behind the nation's economic growth, Gross Domestic Product (GDP), a number of questions were raised. Namely, how much consumption, how much inflation, and how much new debt go along with the headline number of 4.3 percent annualized growth that has been talked about so much in the last seven days.
With the notable exception of Barry Ritholtz over at The Big Picture, it doesn't seem that many others are asking too many questions about what's behind the GDP. Two Georges in Washington certainly aren't looking past the headline statistic of 4.3 percent third quarter annualized real growth - a rate of growth that is the envy of the rest of the Western world.
In a Rose Garden speech on Friday, prompted by Republican Congressmen and at least one Wall Street economist, President George W. Bush gushed:I mean, when you think about the news that's come in - the jobs report, the recent report on strong economic growth, low inflation, strong productivity, lower gasoline prices, a strong housing market, increases in consumer confidence and business investment - our economic horizon is as bright as it's been in a long time.
Well, one thing about bright horizons is that it's hard to see where you're going - glare can be a real problem.
On Sunday's This Week with George Stephanopolous, George Will, ever the supply side cheerleader, opined:This December we entered our fifth year of this expansion, as George just said, thirty months, ten quarters, average growth rate of 4.1 percent, the economy is booming. Why do people not think so?
As we've seen before, George Will's economic analysis, like many others today, is superficial at best. He seems to be much better at repeating talking points than he is in understanding, or even wondering about, what's behind the talking points - kind of like Treasury Secretary Snow.
...
All economic news is bad. Housing prices go up - housing bubble. Housing prices go down - slump in housing. Unemployment goes up - that's bad. Unemployment comes down - the labor market is overheating and inflation's coming back. There's no such thing as good news.
...
The American people talk to polltakers like pessimists; they go to the mall like optimists. People say oil prices have spiked briefly (they've come down) costing the American people $120 billion extra dollars this year. Kind of a one percent sales tax equivalent. Why are people still shopping so well? Well, because their housing value went up this year $2.5 trillion.
To those like him, it seems natural that consumer spending is doing well because home values have risen at absurd rates, and when questioned about all the money that's been borrowed against these houses to support spending, the next answer comes just as naturally - we are doing foreign lenders a favor by giving them a good place to invest their money.
The savings glut theory.
One thing is clear, in all the talk about GDP, everyone acknowledges the importance of the consumer, and the peril that awaits the world economy should the American consumer pull back in a big way. The mainstream media mentions how important consumer spending is to our economic well at every opportunity - holiday shopping, auto sales - it just comes out naturally without thinking about it, as if it's always been this way.
The American economy, like no other economy today, and like no other time in American history is supported by consumer spending.
So, just how important is consumer spending to the 4.3 percent GDP number that has been repeated over and over in the last week? The major components of GDP are consumer spending, investment (non-residential, residential, and change in inventories), net exports, and government spending.
A depiction of how these cateogories have contributed to GDP in the last ten years is shown in the chart below:
Click to enlarge
That's a lot of spending. You can clearly see how personal consumption as a percent of total GDP has increased in recent years, but in addition, the residential fixed investment category shows a marked increase as well.
So what has consumer spending looked like over the years? Historically, what portion of GDP can one expect to come from the consumer?
The data from the Bureau of Economic Analysis goes all the way back to 1929, but making a chart that goes back that far would require way too much explanation - that will be a good exercise for another day. Going back to 1950, after the Great Depression and World War II, one trend is very clear - things have changed in the last twenty years.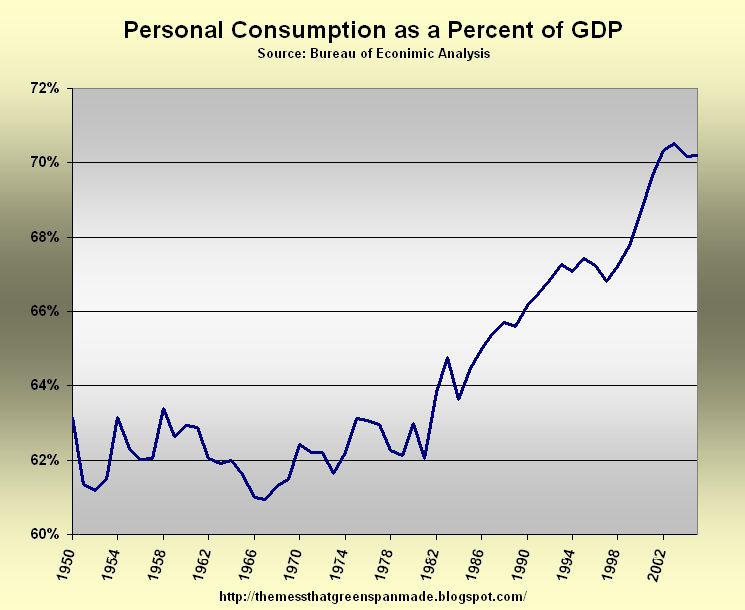
Click to enlarge
Since the 1980s, consumer spending has become increasingly important to economic activity. The enabler? Credit and debt, of course.
First credit cards, now home mortgages.
So, what portion of consumer spending is funded using borrowed money? A good question and not an easy one to answer. One statistic that can help to answer the question is the now-famous Federal Reserve study showing that Americans borrowed $600 billion against their homes in 2004.
Over at The Big Picture, Barry says:The U.S. consumer's spending via debt and savings amounted to an additional 1.4% nominal GDP. Without that profligacy, GDP would have been more like 2.9%. That a third of GDP is based upon consumer borrowing is hardly a sign of healthy, sustainable economic growth.
In a now classic (not really) chart from this post almost six months ago, when we first began to wonder about such weighty issues as debt financed economic growth, it is clear that credit and debt have been the fuel that powers the consumer locomotive that is our economy.
Click to enlarge
This is the amount of consumer debt that is still outstanding - as in, not paid off.
More than a trillion dollars in the last ten years that has yet to be repaid. Compare this figure with the first chart and it becomes clear that maybe a new measure of GDP should be devised - one that is ex-debt. Excluding debt-financed spending.
Wouldn't offsetting the increase in GDP with the increase new debt seem to be a far more reasonable measure of economic growth or economic well-being?
Isn't it natural to wonder how long we can continue to do this?
The two Georges at the beginning of this piece do not seem to be concerned. Should you?

6 comments:
I am amazed by the constant high quality information you post day after day.
I am delighted by your wits that brighten the horizon which only the people occupating the White House can see in the economy.
Compliments
the puppet masters - as superbly stated by dan's post - will continue playing this shuck and jive game for as long as the puppet masters deem the game's importance to be vital to their own personal agenda:
feed them their bread, and give them their circuses.
the endless drama that continues to unfold in this nation - scare the people with the threat of war and more war to come (as seen in miami with the 'assassination' of the non-bomber bomber...), and then distract them with every message to buy and spend and buy and spend while the very infrastructures of health and education becomes denied to those in need of health and education, because a stupid masses becomes far more easily to control, don't they....?
i am thankful - very thankful - for this blogger you have created tim. i am going to past this blogger to others who need to read and contemplate the shuck and jive game of the puppet masters....
thank you tim for this blogger.
Would you post a comparison graph showing the ratio of consumer debt to nominal GDP over the same time period?
Thanks,
Morgan
I plan to do that, probably next week. I've heard how the number has grown in recent years and I've heard people quoting ratios like 6 to 1, but I've never seen a chart.
Thanks, tim. I suspect that the growth of GDP will somewhat offset the growth of Consumer Debt, but that there will still be a marked rise in the ratio over time. I think the result will be more easily interpretable.
On the other hand, it might actually be better to look at the ratio of Consumer Debt to Total Household Income, or even of Total Payments on Consumer Debt to Total Household Income, if you can find the data. After all, if total payments on a $300,000 house are the same as the payments on a $200,000 house 10 years ago, I'm not deeper in debt, practically speaking, even though I "owe" 50% more.
The Mess That Greenspan Made
by movermike
The Mess That Greenspan Made has posted a very good piece called More Questions About GDP. In it Tim Iacono writes
With the notable exception of Barry Ritholtz over at The Big Picture, it doesn't seem that many others are asking too many questions about what's behind the GDP.
What prompted me to comment on Tim's post was a transcript posted at Le Metropole Cafe of a lecture by Dr. Kurt Richebächer at the International Precious Metals & Commodities Fair in Munich, Germany on November 19, 2005.
Mover Mike http://www.movermike.com
Post a Comment