


![[Most Recent Quotes from www.kitco.com]](http://kitconet.com/charts/metals/gold/t24_au_en_usoz_2.gif)
![[Most Recent Quotes from www.kitco.com]](http://kitconet.com/charts/metals/silver/t24_ag_en_usoz_2.gif)
![[Most Recent USD from www.kitco.com]](http://www.weblinks247.com/indexes/idx24_usd_en_2.gif)
Income, Wealth, and Debt
Tuesday, February 28, 2006
With the decline of real wages in the U.S. garnering more and more attention lately, and with the Federal Reserve's recently released Consumer Finance Survey (PDF) showing dramatically slowing growth in net worth, it is natural to wonder where we'd be right now if housing prices hadn't doubled in recent years - or tripled, depending where you live.
Wages have gone nowhere, real estate has boomed, and debt has boomed right along with it. Should that be surprising? In the most recent survey period, from 2001 to 2004, broad stock indices were about flat, leaving savings and real estate appreciation as the primary contributors to larger numbers on the assets side of the net worth ledger.
And by now, most should be familiar with the paltry savings rate of recent years
This is in sharp contrast to the heady 1990s when the savings rate was a positive number and many experienced the original wealth effect of rising share prices. As this wealth dissipated after the bursting of the stock market bubble, rising housing prices were there to take up the slack.
However, unlike the 1990s, this new wealth had a rather large companion along for the ride - debt.
One of the greatest misconceptions of our day is that home equity extraction is akin to an ATM - the "Housing ATM", as the mainstream media innocuously refers to it. Most people think of an ATM as dispensing money from their checking or savings account, when in fact the housing ATM is much more like a cash advance on a MasterCard or VISA - money that is borrowed and must be repaid.
During the most recent survey period, total debt reported by consumers increased by over 26 percent while incomes were basically flat.
Not surprisingly, the gap between lower income groups and the very wealthy has grown in recent years. There was a 6 percent rise in net worth for the top ten percent of households, while the lower 25 percent saw their bottom line decline during this time.
This is evident in the chart above where the mean (average) change to net worth is roughly five times the median change to net worth. Income
Looking at the changes to incomes during the most recent survey period, it becomes clear that whatever increases to net worth have occurred have not been a result of increased savings from increased earnings.
If you're a homeowner with the toll-free number for Ditech.com at the ready, this chart probably has little relevance to your way of life today, as housing wealth has masked stagnant income for many Americans.
Spending habits have long since become detached from the fundamentals of income, however, that may change sooner than many would like to believe.
Detaching from fundamentals is rarely a good thing. Re-attaching to fundamentals is usually a painful thing.
The Sampling Period
In fairness, the sampling periods for the cited survey unduly influence the first chart as is evident when looking at the Federal Reserve Z1 Flow of Funds data for household net worth as shown below. The survey periods from the first chart match up fairly well with the 1995-1997, 1998-2000, and 2001-2003 periods below.
It is also clear when looking at the Flow of Funds data, that in the last three years net worth is rising.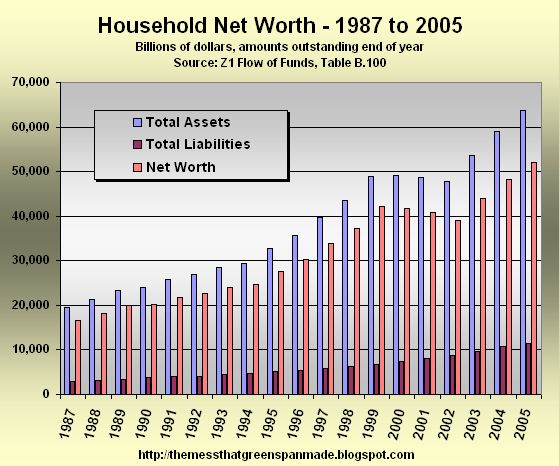
Of course, the increase in liabilities is rising as well, the slope of the curve steepening beginning in 2003 when home equity extraction began in earnest.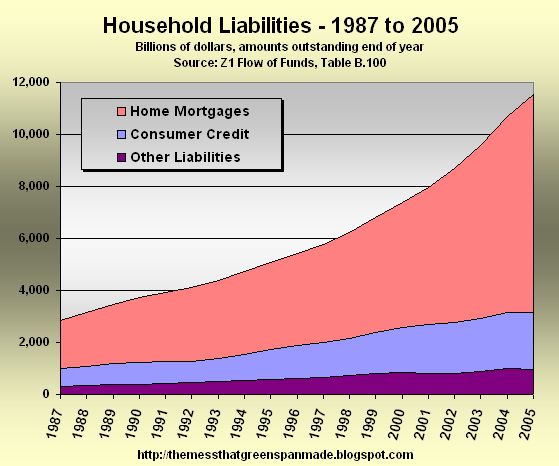

2 comments:
Since you are based in SoCal and have provided special insight to that region, let me report on some data from my home region, the Northern Virginia area:
http://www.furl.net/item.jsp?id=7250308
This pair of charts paints a forboding picture for the next year or two southways of the greater Washington metro area.
I had previously thought this area would be insulated, given the government (homeland security) buildup. Some 250,000 engineering jobs have been sucked into the area in the last 5 years, if I recall correctly. This doesn't even include other professions, so you can get an idea of the effect on real estate.
But this thesis failed to take into account that government buildup can only go so far so fast, and inevitably screeches to a halt (indeed, it usually rebounds from its most massive surges as the political winds shift). With the size of government in the DC area plateauing, in fact, the logical conclusion is that the market there should face a more precipitous deflation than the usual locale.
This is because a large portion of the "boom" was in fact due to influx, not just speculation. With the influx stopping and the speculation stopping at the same time, the downslope in real estate metrics should be steep.
Someone close to me put themselves half a million dollars on the line in speculative real estate, at the peak of NoVA's bubble, and remain exposed.
They hadn't consulted me first.
Great summary view and must read. Enjoy.
http://www.weedenco.com/welling/Downloads/2006/0804welling022106.pdf
Post a Comment