


![[Most Recent Quotes from www.kitco.com]](http://kitconet.com/charts/metals/gold/t24_au_en_usoz_2.gif)
![[Most Recent Quotes from www.kitco.com]](http://kitconet.com/charts/metals/silver/t24_ag_en_usoz_2.gif)
![[Most Recent USD from www.kitco.com]](http://www.weblinks247.com/indexes/idx24_usd_en_2.gif)
Friday Lite
Friday, October 13, 2006
Normally, the real estate sales data for Southern California is released to the general public a few days after it is provided to the local papers (which just happened yesterday), so it is a bit surprising to be publishing updated charts on this topic in today's Friday edition. Nevertheless, duty calls.
This month's news is not good - the local papers are now full of headlines like these:
Home Sales, Prices Still Falling - Signs on San Diego
Home Prices Drop for First Time in Five Years - Ventura County Star
Home Prices Slide for Third Straight Month - Orange County Register
In an online poll from the Ventura County Star, they asked readers if they are worried about the drop in home prices. Almost 200 responses were tallied with the following results:
Optimism is still high - particularly for renters.
And Then There Were Two
Yesterday, DataQuick released the September real estate sales data for Southern California. San Diego now has company below the zero mark on the y-axis of the chart depicting the year-over-year change to the median home price.
To no one's surprise, it is the same county from which this blog originates - Ventura.
Sales volume in these parts is rather low compared to other areas in Southern California, hence the price volatility as shown in the chart below, so it wouldn't be surprising to see the violet line pop up over the zero level in the months ahead, but the overall trend seems to be clear. Click to enlarge
San Diego County prices are now down 4.4 percent from year ago levels, along with Ventura County prices that have declined 3.3 percent. Overall in Southern California, prices are up 1.9 percent, led by Riverside County where a yearly increase of 8.0 percent was seen.
The bad news is that there is still plenty of room to go to the downside. With rising long term rates and new guidance to reign in the more toxic of the nontraditional mortgage products, this may be just the beginning. Will it be a flattening out or a downward correction? We'll see.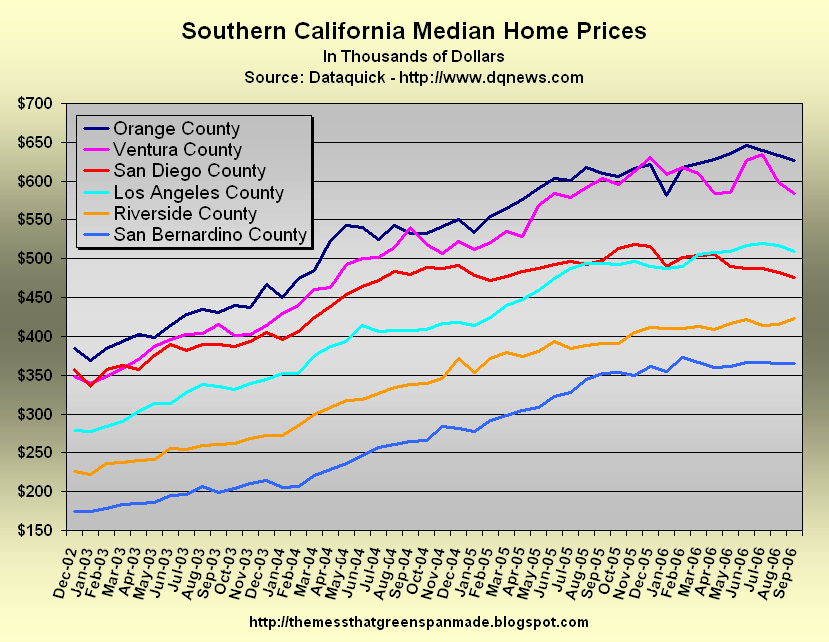 Click to enlarge
The folks at DataQuick aren't quite as cheery as they were last year, but they do seem to be adapting. Marshall "almost all, if not all, of those gains are here to stay" Prentice had this to say about the most recent data:"Now is when things get interesting. The vast majority of home buyers have done very well for themselves the past few years. As things level off, though, we should be able to quantify how many buyers overpaid during the frenzy, and by how much. And more importantly, how they manage any financial challenges they encounter. Historically most homeowners in that situation tough it out and wait for the market to go up again."
Marshall seems to be about three-quarters of the way along in his transformation from 2005 cheerleader to 2007 realist. He appears to have just transitioned through denial and anger, showing his first signs of acceptance of the new reality in the California housing market.
Yes, now is when things get interesting.
Big House Bob Confirms: This trend is not your friend
Writing on the local housing market, San Diego realtor Bob Casagrande notes that it's really worse than it looks out there. Most sellers are either unrealistic by a wide margin, or they're just hoping to get lucky.The average detached home in inventory is 2,282 sq ft with an asking price of $899,180 where the average home sold in September was 2,494 sq ft with an average asking price of $757,227.
Since so many homes are purchased with no money down these days, and with sales volume in the thousands per month, there must now be tens of thousands of homeowners in San Diego who owe more than their home is worth. That may be a problem someday.
...
The typical detached home sold was 2,050 sq ft with an average selling price of $626,296, this is down about 9% versus last years average of $691,608 for the same home. We see the same trend with attached homes, with this year's average of $395,936 down about 6.5% from last year. One has to be very careful with prices since you will see a lot of variance in the price changes from neighborhood to neighborhood, house style to house style, etc. However, one can conclude that in general prices are declining. These price trends will continue until we see a major downward movement in the current inventory supply of over 300 days. Buyers need to continue to be price savvy and serious sellers need to understand the importance of pricing right from the beginning.
Some Very Simple Explanations
This picture has been sitting around, waiting for just the right opportunity to use it in an appropriate context. After details of last week's speech by Alan Greenspan became known, it is clear that the appropriate context is now at hand.The great boom in US house prices that abruptly petered out in recent months was caused by increased global integration, not loose monetary policy, Alan Greenspan, the former chairman of the Federal Reserve, has claimed.
The system "ran out of steam" and soaring asset prices were a result of "billions of cheap laborers" - now it all makes sense. Freakishly low interest rates with virtually no regulation of mortgage lending had little to do with the housing boom. "I don’t think that the boom came from a 1 per cent Fed funds rate or from the Fed’s easing. It came from the collapse of the Berlin Wall," Mr. Greenspan told a private audience in Canada on Friday.
The former Fed chairman said the collapse of Communism in eastern Europe and the shift towards more market-based economies in China and other parts of the developing world brought “billions of cheap labourers onto the scene”.
This, he said, “brought disinflation and lowered inflation risk premiums and long-term interest rates, creating a decline in real interest rates and equity-risk premiums.”
In consequence, “the real market value of assets increased faster than GDP”.
Mr Greenspan said the system “ran out of steam as no one could afford houses any more.” But he said the worst of the housing correction may already be over.
Ben, we need more steam!
Guess the Year-End Prices for Oil and Gold, Win Big
This is your last chance to guess the price of gold - both the yellow and black varieties - and win big. At midnight tonight all entries will be tabulated and placed into a locked vault to be opened on New Years day of 2007 . Whoever guesses closest to the year-end price for these two important commodities wins a free one-year subscription to Iacono Research.
Here are some charts to help you along with your prognostication.
 The combined percentage differences between the guessed values and the closing prices on December 29th will be used to determine a winner. Entries may be made either by sending mail (see above right - Send Me Mail) or posting them in the comments section below.
Special recognition will be given for the best snarky comment, given recent price trends.
Picking up Nickels in Front of Steamrollers
The Economist must be commended for adding the Buttonwood column to the print edition a few weeks back. This story about carry trades and hedge funds both informs and entertains.The carry trade is essentially a bet on lower volatility. To take an outright gamble that markets will barely move, an investor would write (sell) options; this approach would bring in premium income, but would lose money if prices changed enough for the options to be worth exercising.
That appears to be Brian Hunter of Amaranth Advisors flattened on the front roller.
In the foreign-exchange version of the carry trade, an investor receives an income by borrowing a low interest rate currency and owning a higher-yielding one. This produces a positive return most months, but the risk is that the high-rate currency will devalue, resulting in a heavy loss.
Cynics have described these bets as “picking up nickels in front of steamrollers”. A long series of small gains is punctuated by the occasional wipe-out. However, from the point of view of a hedge-fund manager, it is a perfectly rational approach.
...
But the important point is that financial markets are a complex adaptive system, in which the actions of participants affect the fundamentals. The best analogy might be the “seat belt” attitude to risk. In theory, having seat belts in cars should save lives. But the presence of seat belts may cause motorists to drive faster, leading to no improvement in road safety. That has led some to theorise that people have a mental budget for risk; if it is reduced in one area, they will compensate by taking more risk in another.
Thus the low level of volatility may make investors overconfident, taking on more risk either by buying exotic investments or by using debt to finance their positions. When bad news does occur, those investors will be dangerously exposed. Low volatility and the carry trade sow the seeds of their own destruction.
She Would Struggle to Leap Over a Bucket
This is the story of Thumbelina, the world's smallest horse.Standing just 17 inches tall, she is never going to be a champion show-jumper. In fact, the tiny mare is so small she would struggle to leap over a bucket.
For extra credit, locate the memorable quote from the original City Slickers that applies here. (Hint: the big horse is Curly, the little one is Mitch).
But such things are of little concern for feisty Thumbelina who has just been officially recognised as the world's smallest horse.
The five-year-old received the title from the Guinness Book of Records after her astonished owners realised she was never going to grow any bigger.
She was born on a farm in America to a couple who specialise in breeding miniature horses.
These popular show horses usually weigh about 250lb and reach a height of 34 inches when they are fully grown.
...
Thumbelina survives on a cup of grain and handful of hay, served twice-a-day.

25 comments:
Oil: $64
Gold: 615
Aw, what the hell. Oil $65, gold $650.
It seems to me that the winter energy demand season will bring some sanity back into an overcorrected energy complex. This will influence gold and other commodities.
But this isn't a pick with high confidence; I'm not a near-term market timer =)
How is it the quote goes? "The market can stay irrational longer than you can stay solvent." Which is why I try not to be very leveraged ;)
OK, me too - $63 and $680.
Tim,
I imagine you plan to publish a table of the end of year picks, replete with statistical analyses. Have there been enough data points to see a nice distribution?
Yeah, some charts with the distribution of guesses would be a good idea. I haven't done a count, but between last Friday, today, and email, there's plenty of data - not surprisingly, mostly a bullish crowd.
I must say that I am disappointed in how few snarky comments have been received.
Gold: 800
Oil: 68
i have no idea what i would do if i won, since all my money goes to daycare and taxes, but it can't hurt to make a guess -- i might learn something inthe process.
$629 for gold, $55 for oil
shinji
by the way, that picture of greenspan is hideous.
Gold: $550
Oil: $62.50
Re:
"I must say that I am disappointed in how few snarky comments have been received."
At some point, the correct diagnosis begins not to appear contrarian. Fret not. After all, this is no longer phase 1.
Gold 683.12
Oil 66.06
"A man's home is his castle, in a manor of speaking."
Oil: $64
Gold: $650
I assume that you are going to be using the continuous contract for pricing? Not a specific futures contract?
I crap bigger than you!
BTW, that isn't Brian Hunter pasted to the roller. It's Amaranth investors. Hedgies know full well that their bets will eventually blow up. The goal is to rake in outrageous fees and commissions for a few years and then move on. Mutual funds are just a milder form of the same spice.
Oil: $90
Gold: $900
CNN: "Buffalo buried in snow".
Oil: $68
Gold: $630
As soon as Paulson and GS get their grubby little hands off the futures markets (hopefully no earlier than December, I have a lot of stock to sell!) markets will reestablish a reasonable price.
Gold $553
OIL $61
Complacency of the masses leads to sheep giving the coats off their backs.
Oil:$58
Gold: $580
People are talking about changing this at Change Everything http://www.changeeverything.ca
Me too. Me too.
Oil $72
Gold $620
cold winter and some crazy Bush saber rattling at Iran a comin'
Oil: $75
Gold: $750
Thanks for all the interest - please submit any additional guesses by midnight tonight.
Snark: Thanks for stepping it up
Continuous Contract: I was planning to use the front month contract for Nymex Crude - not sure if that would be the January or February contract on December 29th.
My Guess: $666 and $66 (this has nothing to do with the devil, and naturally if I win, I will not be able to accept the prize and it will go to the runner-up).
What Next: I plan to create a scatter chart with the price of oil on one axis and gold on the other. Every guess will be represented by a dot and I'll update it maybe every other Friday indicating the current prices with a star or something, so everyone can see how far away they are.
IMPORTANT: I don't want to exclude current subscribers, and I apologize for mentioning this so late. Current subscribers can win a one-year extension or a guest subscription. I'll be sure to put a note in this weekend's update.
Post election ramp into year end and some more Bush saber rattling against the axis of evil will end the commodity correction assuming no more stupid hedge fund blow ups.
So how about this mind boggling forecast:
oil: $66.66
gold: $666.66
geez, tim beat me to it while i was still typing. hopefully i can still claim the prize if it hits the sixes.
gold 520
oil 52
Gold $471
Oil $56.64
Post a Comment