


![[Most Recent Quotes from www.kitco.com]](http://kitconet.com/charts/metals/gold/t24_au_en_usoz_2.gif)
![[Most Recent Quotes from www.kitco.com]](http://kitconet.com/charts/metals/silver/t24_ag_en_usoz_2.gif)
![[Most Recent USD from www.kitco.com]](http://www.weblinks247.com/indexes/idx24_usd_en_2.gif)
On Regression to the Mean
Tuesday, October 17, 2006
Recent statistics have confirmed what many have long feared - the end of the housing boom in many parts of the country. There is now increasing talk of "a return to normal" in the nation's real estate markets - a return to "normal levels of appreciation" some say.
Does it really work that way?
If the boom is indeed over, after a huge run-up in prices in recent years, why would price appreciation return to normal?
Isn't it more likely that prices would return to normal, as in a regression to the mean?
In probability and statistics, regression to the mean describes the tendency for things to return to normal, whatever it is that normal might be. In the case of housing, a regression to the mean would imply a return to long established price trends based on historical levels of appreciation.
Regression to the mean is something that many homeowners and homebuyers are likely to learn about in the years ahead since most things behave this way. Despite the best efforts of homebuilders and originators of mortgage credit, housing is not likely to be an exception.
Back to the long-term trend, not to the normal rate of change
Regression to the mean does not imply a return to a normal rate of change, but rather, a return to the long-term trend - what would be expected as an end result years from now given historical averages.
So, for example, if the average annual appreciation for real estate in a particular area is seven percent, and a few years of twenty or thirty percent appreciation occur, a regression to the mean implies a return to the long-term trend that was in place before the rapid price increases.
Looking at the last few decades of home price data in Phoenix and in the U.S. in the chart below, the situation become a bit more clear. While home prices on a national level have risen briskly in the last few years, this part of Arizona seems to have set a few records in recent years.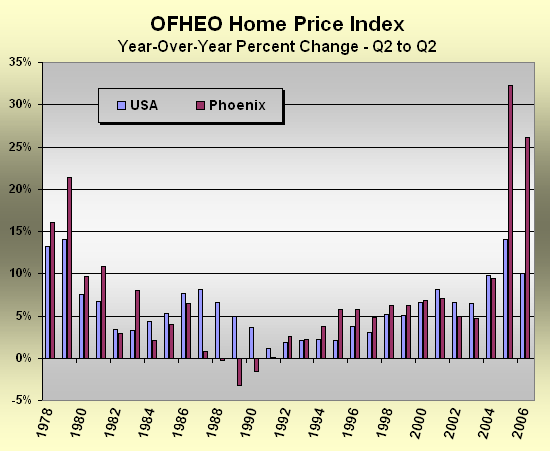 A long-term average of six or seven percent appreciation seems reasonable from looking at the chart above, but after the increases of the last few years, it's natural to wonder what might lie ahead. If the late-70s to mid-90s experience is any example, there are sure to be some below average years of appreciation coming to Phoenix.
But, how far below average?
It depends on how quickly prices move back to the mean.
If the average increase is seven percent, what would it look like to revert to the mean after consecutive years of ten percent, 32 percent, and 26 percent appreciation as was the case in Phoenix?
That same question arose in a recent Money Magazine article where a reader asked for advice regarding an upcoming rent vs. buy decision, one of many considerations in their relocation to Phoenix. Here's the advice that was offered:The first thing you need to ask yourself is how long you plan to live in Phoenix. If you'll stay less than two years (five in a city that's growing more slowly than this one), go ahead and rent because by the time you pay closing costs and broker's fees on a purchase and sale, you'll lose 5% to 10% of the home's value.
Now, the advisor does a pretty good job of explaining the situation up until the point where long-term appreciation is involved. It seems that, as a nation, we have difficulty in this regard, perhaps accustomed to having our gratification instantly whenever possible.
If you plan to stay longer, the math gets fuzzier. Unlike some cities, Phoenix has an abundant supply of single-family rental housing. And home prices have risen faster than rents lately, which has made renting unusually attractive. Consider our simplified calculations: You can rent a three-bedroom, two-bath house in a nice neighborhood for about $14,600 a year, including renters insurance. The same home might sell for $450,000. With your $70,000 down payment, if you took out a 30-year fixed-rate mortgage, you'd be spending some $31,100 annually after tax deductions, including insurance, property taxes and maintenance.
Measured by cash flow, renting is cheaper, hands down. But home ownership is also an investment decision. To make up the $16,500 annual difference in cash outlay, your property would have to appreciate by about 3.7% a year. If you think you'll see growth of that much or more, buying might be the way to go. But the market is tough to call. Phoenix's prices are up 11.8% from a year ago, according to the National Association of Realtors, but that rate obviously can't be sustained. And if Phoenix's long-term growth rate were to drop back to the U.S. historical average of 6.7% appreciation a year, the adjustment could be painful.
According to OFHEO data, since 1978, there has been little difference in the "long-term growth rate" between the nation's housing stock and the housing stock in Phoenix - six percent and seven percent, respectively. And even if there were a big difference, that last sentence in the advice above, no matter how many times you read it - it just doesn't make any sense.
Given what is going on in Phoenix right now, 'ghost towns' appearing here and there, many homeowners would surely be pleased with the prospect of resuming the long-term growth rate of near seven percent, but that is not likely to happen.
What the writer was probably trying to describe was the painful adjustment process in reverting to long-term trends, or in regressing to the mean. Those painful possibilities, both for the renter seeking advice and for the many thousands of others pondering an Arizona real estate purchase, are shown below.
The chart shows two curves - actual home price data through the second quarter of 2006 and the long-term trend projected from 2003, when many homebuyers stopped caring about prices paid, using the historical average of 7 percent appreciation.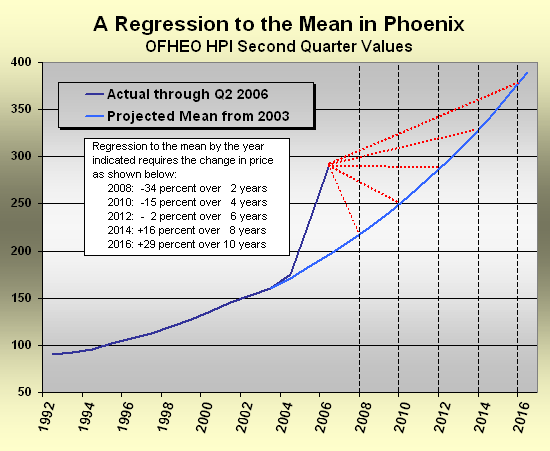 A couple of quick calculations help to demonstrate the possibilities. If it takes six years for Phoenix home prices to make it back to the long-term trend, that would leave a homebuyer down $10,000 on a $450,000 home purchased today, in addition to repairs and other expenses. That doesn't sound too bad, but six years is a long time.
If the process took eight or ten years, this would leave the homeowner in the black by $72,000 and $130,000, respectively. Interestingly, taking the $16,500 per year saved by renting, as noted above, and banking it at just four percent yields $111,000 and $133,000 for the same periods.
Naturally, the worst case would be the two-year and four-year price moves where today's $450,000 home would be worth $297,000 and $383,000, respectively. Ouch!
But the prospects for homeowners could potentially be worse than that shown above - in addition to there being a tendency to revert to the mean, there is also a tendency to overshoot during the process. This is what happens when an entire nation sours on the idea of owning something - think common stocks in 2002, and maybe real estate sometime in the years ahead.
On the bright side, it's always possible that things will be different this time.

9 comments:
"And if Phoenix's long-term growth rate were to drop back to the U.S. historical average of 6.7% appreciation a year, the adjustment could be painful."
What time period is used to compute that historical average? My understanding is that, over the past 100 years, homes appreciate 0.4%+inflation.
The growth rate has been much higher in the last 30 years than in the previous 70. The 6.7% probably refers to the last 30.
The growth rate has been much higher in the last 30 years than in the previous 70. The 6.7% probably refers to the last 30.
"in addition to there being a tendency to revert to the mean, there is also a tendency to overshoot during the process."
Everybody talks about Japan real estate bubble but I think our little housing bubble here in Finland in the early 90's was much more similar to your current US housing bubble.
The economic statistics across the field between those two are pretty much the same or worse for the US at the moment. The house prices in Finland did not just go smoothly to "long-term average" but dropped below that line about 20-35 percent from the peak 1989 to 1993 (total of about 50 percent drop)!
Now I see very similar "screw the lending standards" wild game going on among US banks. Everybody with a pulse did get a loan back then and so it was in the US too until now.
The party in Finland was over within one year and then the real fun started. First it was the house builders, then the consumers and then banks started to have big big troubles with all of those risky loans. The unemployment did shoot from five to 15+ percent and interest rates from about five to 17 percent. Our government indebtness went from under 15 percent to 70 percent of GDP in five years.
Eventually a huge government intervention with special "junk loans bank" was needed in order to restore order.
So your 450 000 dollar home could be priced way below 200 000 at the market bottom in a 1-4 years from now.
On top of all of this, there hasn't been a building boom quite like the present one, either. The interesting feature of this boom was the leverage involved (options and joint ventures, for those that haven't heard by now). Some builders seem to be in the 50% of book value range for these beasts.
So what? Well, the "creative financing" that has been engaged in means basically all these assets become liabilities as soon as appreciation stops happening, and they need to be written down and unloaded as quickly as possible (often by banks who received them in bankruptcies). And that spells "price crash."
I don't see how this housing bubble is going to be able to avoid a significantly quicker drop than the historical template.
More details on the financing, and my commentary here (not new, but recent).
Pay attention to tim73, btw. He is right. The situation in the US looks a lot more like Finland than Japan (see my post on Japan .)
Hong Kong also suffered a terrible housing crash from 1997-2003. Prices fell on average by 70%.
To put it mildly, not a happy time.
Hong Kong was different than all of the other places in that it was an island of capitalism surrounded by communist China when it was ceded by the British in 1997. Then all of the sudden the land surrounding it became open for business. Also alot of the residents fled for former colonies. It is unique in my opinion unless the urban growth boundary in Portland Oregon dissappears.
This article reminds me of the old adage that a little bit of knowledge can be dangerous. You can't just willy nilly say that the "long term" average that looks good is X, so the mean is X. What does "look good" mean? There is a precise formula to determine which average you should be focused on for regression purposes.
Assuming that your graphs are accurate, for Phoenix, the relevant average for regression to the mean would be 14%. Get a basic education before you write reckless articles.
Get a clue before you go leaving comments on a blog post that is over a year old.
Post a Comment