


![[Most Recent Quotes from www.kitco.com]](http://kitconet.com/charts/metals/gold/t24_au_en_usoz_2.gif)
![[Most Recent Quotes from www.kitco.com]](http://kitconet.com/charts/metals/silver/t24_ag_en_usoz_2.gif)
![[Most Recent USD from www.kitco.com]](http://www.weblinks247.com/indexes/idx24_usd_en_2.gif)
The Week's Economic Reports
Saturday, December 02, 2006
This may or may not become a regular thing - we'll see. It has long been a desire to publish something here at the blog on Saturdays, a day when attention is normally given to the companion website Iacono Research, but there just hasn't been the time.
It occurred to me that the summary of the week's economic reports, part of the Weekend Update that goes out to subscribers on Sundays, might be just the thing to solve that problem since this data is available from many other sources and not specific to any of the investment decisions at the website.
This may seem weird to regular readers because the tone of the writing at the website is very different than what appears in the blog.
Anyway, here it is.
Following is a summary of last week's economic reports. Pronounced weakness in manufacturing and construction were the most important developments for the week, adding to the mounting evidence of a slowing economy. For the week, the S&P 500 Index fell 0.3 percent to 1,397 and the yield of the 10-year U.S. Treasury note fell 12 basis points to 4.43 percent.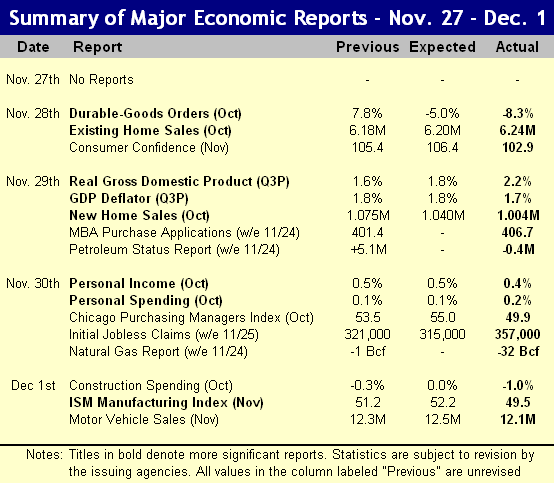 Durable Goods Orders: Orders for durable goods fell 8.3 percent in October, after an upwardly revised increase of 8.7 percent in September. Wild swings in civilian aircraft orders once again dominated the data - in September aircraft orders rose almost 200 percent while in October they fell almost 50 percent. Excluding this category, the trend is decidedly down, however, not as would be implied by the most recent report. The year-over-year change in new orders fell from 15.2 percent in September to 2.3 percent in the most recent report.
Existing Home Sales: Existing home sales rose 0.5 percent in October to an annual rate of 6.24 million after declining for the last six months. Overall, on a year-over year basis, sales are down 11.5 percent. Much of the increase is being attributed to the drop in sales prices, the natural consequence of rising inventory amid sluggish sales. Prices declined a full 3.5 percent from year ago levels, the largest drop ever recorded in this data series from the National Association of Realtors.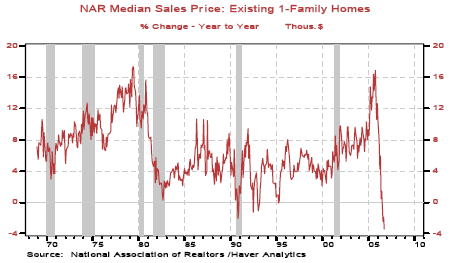 The supply of homes for sale rose slightly to 7.4 months, the highest level in 16 years, up 51 percent from year ago levels. While the sales increase from September to October was a positive sign that buyers are reentering the market, it would appear that more price cutting will be required to reduce the inventory.
Consumer Confidence: Consumer confidence came in well below expectations, the decline from 105.1 to 102.9 reflecting the end of the impact of lower price gasoline in all but the inflation expectations measure that declined from 4.9 percent to 4.7 percent. The outlook for jobs and plans to buy automobiles were both very weak.
New Home Sales: Sales of new single-family homes dropped 3.2 percent in October, coming in significantly lower than expected and the most recent data was accompanied by substantial downward revisions to the August and September data. On a year-over-year basis, new home sales are down 26 percent. Prices increased 1.9 percent from year ago levels after a year-over-year drop of 9.2 percent last month.
Recall that last month sales increased slightly along with the large drop in prices, whereas this month, prices were firm but sales volume declined. The same dynamic was seen in existing home sales released on Tuesday where a higher sales volume was accompanied by lower prices. As with existing homes, new home inventory is still very high at 7.0 months, up from 6.7 months in September, so further price cuts will be required if sales are to be increased on a continuing basis. Also remember that cancellations are at all-time highs, and these numbers do not get added back into the inventory data, creating a misleading picture of supply.
Gross Domestic Product: The second of three reports for third quarter real GDP showed economic growth at 2.2 percent annualized after an advance estimate of only 1.6 percent. This exceeded expectations of 1.8 percent. Following first and second quarter annualized increases of 5.6 percent and 2.6 percent, respectively, the year-over-year change to real GDP now stands at 3.0 percent. Business fixed investment, inventory, government purchases, and corporate profits all rose while consumption was down slightly along with another large quarterly decline for housing (residential investment). Rising inventories, one of the larger changes from last quarter is not necessarily a good thing, especially when combined with slowing consumption.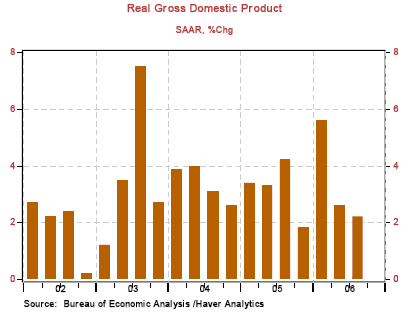 The overall GDP chain deflator was unchanged at 1.8 percent for the quarter, down from 3.3 percent in the second quarter, while core PCE came in at 2.2 percent, revised downward from 2.3 percent in the advance estimate. This is all good news for the Federal Reserve - with the statistics showing that both inflation and economic growth are moderating, fears of stagflation ease, but this data is now three months old and oil prices are now on the rise again.
Personal Income and Spending: Personal income rose 0.4 percent in October following a 0.5 percent increase in September. From year-ago levels, the increase in wages held steady at just under six percent. Spending rose 0.2 percent after a downwardly revised drop of 0.2 percent the prior month, this measure being influenced once again by less spending on nondurable goods, notably gasoline. The personal saving rate increased marginally to -0.6 percent, now in negative territory for more than a year.
Chicago Purchasing Managers Index: The Chicago Purchasing Managers Index fell below 50 for the first time since the spring of 2003. With a reading of 49.9, well below the expected increase to 55.0, this is evidence of continuing weakness in the Chicago area manufacturing sector. A reading above 50 indicates expansion, below 50 indicates contraction.
Leading the decline were measures for supplier deliveries that declined from 54.1 to 43.0, marking their lowest level in over five years. Employment was also very weak declining from 57.0 to 49.4, the lowest level in almost three years. Prices paid, while lower than in previous months, continue to provide support to this index.
Initial Jobless Claims: The increase of 34,000 new claims for unemployment insurance was surprising to many, as the consensus estimate was for a slight decrease from the week before. At 357,000, this is the highest level for new claims since the spring of 2004, excluding the Katrina-affected data from last fall.
While seasonal adjustments in a holiday-shortened week are responsible for some of the increase, this marks the third week of the last four with unusually high claims and the four week moving average now stands at 325,000, its highest level in six months. Recall that jobless claims closer to 400,000 per week are normally associated with a troubled job market.
Construction Spending: Weakness in both the residential and nonresidential sectors caused construction spending to fall a full 1.0 percent in October after a 0.8 percent decline in September. Private residential construction fell 1.9 percent, led by a decline of 3.9 percent in single family homes, while multifamily construction rose 1.6 percent.
Private nonresidential construction fell 0.7 percent, the second consecutive monthly decline, bucking the trend of recent months where the nonresidential sector continued to grow as construction of private residences fell. This is a significant development in that many observers had taken solace in the fact that the boom in nonresidential building had taken up the slack for waning residential construction. This now appears to be reversing also.
ISM Manufacturing Index: Confirming the Chicago area report on Thursday, the broader Institute for Supply Management's purchasing managers' index (PMI) showed that manufacturing is now contracting, down from 51.2 in October to 49.5 in November. This is the first time that the PMI has come in below 50 in more than three and a half years. New orders and backlog orders now stand at 48.7 and 46.5, respectively, with prices paid remaining one of the dwindling number of components over the 50 mark. The two manufacturing reports this week confirm the slowing that has been building in recent months, finally showing up as economic contraction in the official manufacturing statistics.
Summary: This was an abysmal set of reports regarding economic growth. The higher than expected third quarter GDP growth and mild inflation reflect activity from three months ago, so as an indication of current trends, they are essentially meaningless. The continuing weakness in manufacturing and construction show no signs of abating, the important manufacturing indexes now showing contraction for the first time in more than three years. With the possibility of pressure in the labor market, something that may begin to show up in next week's labor report, and with commodity prices again on the rise, talk of stagflation is sure to be revived.
Charts courtesy of Northern Trust.

4 comments:
I may have missed it in the above, but it is significant that Q2 labor costs were revised down from 7%+ to the ballpark of 2%. This throws a bit of a monkeywrench in attempts to paint the current inflation risks as based on the usual Keynesian suspects.
The 7%-increase figure never looked right to me. We are seeing a trend of compensation trailing inflation, not leading it.
Your site was very good when I found you & has been getting better & better. THANKS.
Thanks anon (if that is your real name).
Aaron - as long as everything keeps going up we'll be OK.
Post a Comment