DataQuick on Housing
Wednesday, January 17, 2007
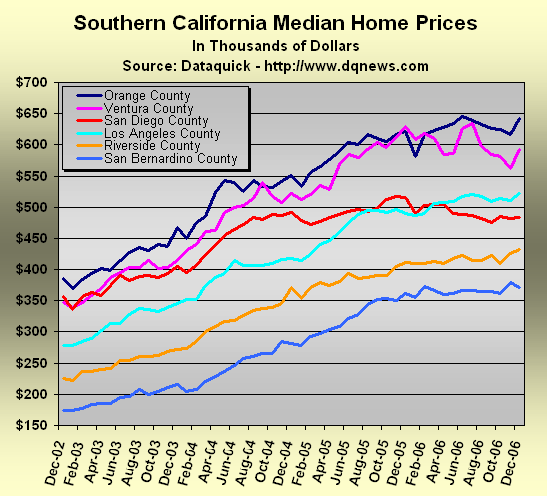
DataQuick reported December real estate sales data for Southern California yesterday. It was pretty much the same story that has been told here for the last year or so - while sales volume continues to plunge, prices continue to flatten out right around the half million dollar mark.
A half million dollars for an average home...
After a few years, it all seems so normal now - a $300,000 home is what poor people live in, to get something nice you have to spend at least twice that amount, and million dollar homes?
Not really a big deal anymore.
There are lots of million dollar homes in Orange and Ventura Counties. Prices ticked up there last month as the well heeled closed on new digs just in time for the holidays.
Home prices in San Bernardino County reversed course after last month's bounce. Having passed through there recently on a trip to Arizona, it sure seems that average prices in the $375,000 range are way too high - in the chart above, that's the only county that has doubled in price over the last four years.
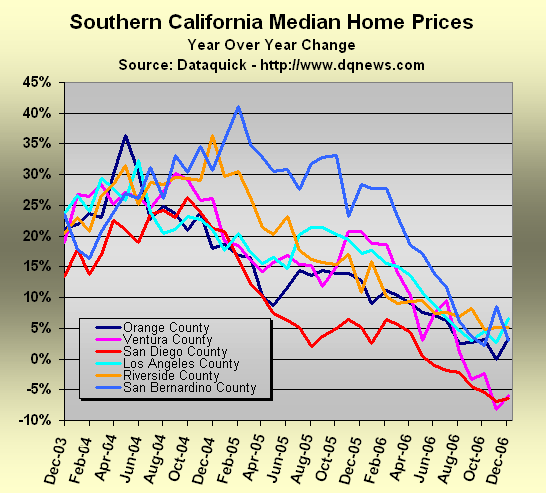
In the chart below showing the year-over-year change in price, San Bernardino County had the steepest downward slope up until the interruption last month. A betting man might say that it will be next to dive below zero.
San Diego County takes over from Ventura County as the biggest loser at 6.4 percent below year ago prices. Ventura County, from where this blog originates, may not like being in second place for long - for sale signs are popping up all over the place and sellers are motivated (a word stronger than "motivated" may apply in a couple months - inventory is very high around here for January).
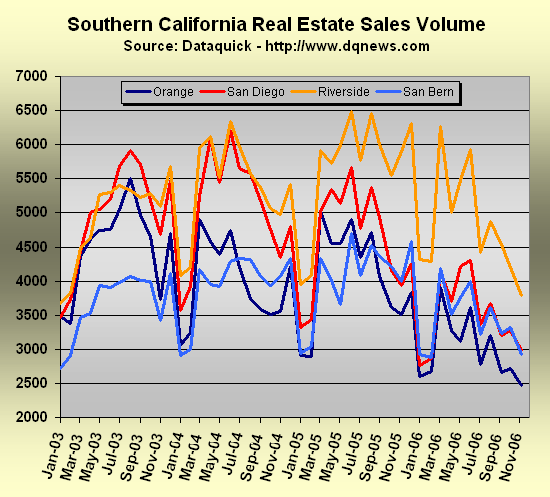
Last month's sales volume in the chart below was the lowest since December 1995 - that was not a very good year, unless you were a buyer. Back then you could have bought an above average home for less than $250,000. That same home would have sold for about $750,00 last year. Who knows what it will fetch in 2007 - pricing is in the hands of buyers and will remain that way for some time to come.
The next two reporting periods, for sales closing in January and February, are historically the slowest months of the year due to buyers and sellers being otherwise occupied during the holiday season. The chart above may become severely distorted as a result.
And prices? Who knows.
The real test will come in the March data that gets reported in April - the combination of high inventory, growing awareness of the housing slump, motivated sellers, and fewer sub prime lenders may pressure prices in a way that surprises a lot of people.
DataQuick President Marshall ("almost all, if not all, of those gains are here to stay") Prentice doesn't seem to be too concerned about home prices. In the most recent report, he commented:In any real estate cycle, when prices peak, they don't level off at that peak, they come down some. The question is, how much? We need to remember that prices have gone up 100 percent in Southern California the last four years. Most of that increase is here to stay.
It's clear that the "if not all" assurance from the price peak of November 2005 is now off the table - now it's a question of the meaning of the word "most".


![[Most Recent Quotes from www.kitco.com]](http://kitconet.com/charts/metals/gold/t24_au_en_usoz_2.gif)
![[Most Recent Quotes from www.kitco.com]](http://kitconet.com/charts/metals/silver/t24_ag_en_usoz_2.gif)
![[Most Recent USD from www.kitco.com]](http://www.weblinks247.com/indexes/idx24_usd_en_2.gif)


4 comments:
Nice work as usual
But look at San Diego's drop - and we led the race up...
there's a long way down to go yet...
On a slightly different tangent, I wonder if the impact of the recent freeze will trickle-down to housing? Ventura County alone will likely experience losses in the $100 million range. Of course all that migrant labor that is no longer needed isn't buying $600K houses but. . .
Thanks for a great article - very comprehensive. I wonder what is the analysis if you consider the prices in different categories - high priced homes, low priced homes etc rather than meadian prices. My hunch is that the higer priced homes are the ones that are really suffering in this market?
Post a Comment