


![[Most Recent Quotes from www.kitco.com]](http://kitconet.com/charts/metals/gold/t24_au_en_usoz_2.gif)
![[Most Recent Quotes from www.kitco.com]](http://kitconet.com/charts/metals/silver/t24_ag_en_usoz_2.gif)
![[Most Recent USD from www.kitco.com]](http://www.weblinks247.com/indexes/idx24_usd_en_2.gif)
Watch the yellow line
Tuesday, August 18, 2009
[Another blast from the past - originally published on August 18th, 2005.]
Like a giant aircraft carrier beginning a turn, huge rudders strain as they are moved to oppose the oncoming rush of water. The force is transmitted throughout the rest of the mammoth hull and the massive ship alters course. On Tuesday, Dataquick reported Southern California housing sales data for July.
Not much happening really as far as the data and the charts go - kind of like that point in time in the game of musical chairs when it feels like the music is about to stop, and everyone slows down and looks at the chairs, then they look at each other, and the music continues to play.
Let's see, what other analogies can we apply here... how about we just look at the updated charts? In the first chart we see median home prices for all Southern California counties for the last two and a half years. What's interesting here again is that yellow line representing San Diego. It is struggling to rise, and is rising, but very slowly in recent months.
Click to enlarge
It is clear from this chart how the year-over-year comparisons could get much more exciting starting next month, since the median home prices in August, October, and December of 2004 were $483K, $489K, and $491K, respectively. Last month the median price in San Diego was $496K.
Also, it looks like the Los Angeles blue line (not the train) will overtake the yellow San Diego line if current trends remain intact. For the last two and a half years there has been $50K to $75K separating the two. We have no idea why they are now converging.
There were three counties with month to month decreases, which is a bit unusual for the month of July. On this chart at least, month to month declines have been more common during August, December, and January. This gives the August data, to be reported next month, even more potential to surprise.
Year-Over-Year Trends
The chart below for year-over-year price change tells the same story it's been telling for a while now regarding the yellow line - nine months in a row of declining year-over-year price appreciation. Still positive at 5%, but headed lower. Would-be sellers who purchased a year ago, expecting another 25% annual price increase, are advised to consult a discount mortgage broker to improve their odds of breaking even.
So, it looks like San Diego is about to break into the low single digits, while Orange and Los Angeles counties buck the trend in a pretty big way. Recent big gainers in the Inland Empire are falling precipitously in annual appreciation - these should be watched closely in the coming months.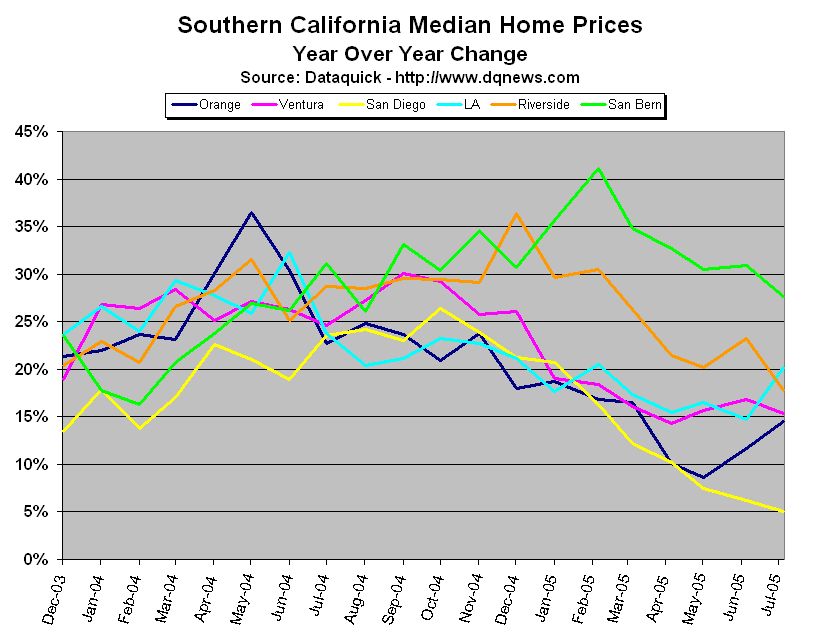
Click to enlarge
So, prices are still rising, volume has declined a bit, and inventory is way up, but people are obviously still buying homes these days - almost 5000 last month in San Diego alone. With all the media attention on housing booms and housing bubbles, especially in San Diego, just who is it that continues to buy? And, are they still using all those wacky loan products in order to qualify at today's sky-high prices?
We just heard on the radio that one-third of all recent home buyers in California are under the age of 35. This is the "Greenspan Generation" (the title of an upcoming essay), not afraid of any kind of leveraged speculation and sure that if something bad happens, there will be no long term consequences. And yes, there seems to be no let up in the number of wacky loans being originated.
What About the Media Coverage?
The housing bubble media frenzy really didn't get going in earnest until back in May, so it's possible that buyers who closed in July really didn't get the full impact of these news stories. Once your offer is accepted, you're thinking about draperies, paint colors, and termites - it's understandable how housing bubble stories would be quickly dismissed once all the ink dries on the purchase agreement.
Those buyers closing in the month of August, however, would have the benefit of about two months of the housing bubble media onslaught. Surely some people who were considering buying in June or July would have decided to just sit tight for a bit after doing just a little reading about real estate in the previous months. Then perhaps they would read a little more. How could you not come across at least ten or twelve stories about the housing bubble and the danger of risky loans during the months of May and June?
Or, are most home buyers still unaware of the potential downside to buying real estate today? Do they just continue to pursue the American dream of homeownership, without thinking about it too much?
The data for the next two or three months should prove to be the most hotly anticipated and intriguing of all housing data for the last few years.![]()

0 comments:
Post a Comment