Wikinvest Wire

A Flawed Mandate

Friday, August 19, 2005

So, here we are in the summer of 2005, nearing the end of the 18 year term of Alan Greenspan. We cannot help but marvel at two things - how lucky Mr. Greenspan was to have started his term when he did, and what a poor job he has done in the last ten years.

The reason we say this is that his term has benefited from one notable condition, low inflation (as measured by consumer prices), and Mr. Greenspan has responded to this condition in an inappropriate manner that has resulted in a series of asset bubbles and global imbalances that his successor will inherit.

Some say that the Greenspan Fed has been "fighting" inflation, and that is why it has remained low. This is far from the truth. Paul Volcker "fought" inflation by raising interest rates to near 20% and inducing a recession. The Greenspan tenure at the Fed has been marked by moderate energy prices and inexpensive imported goods from Asia, which have offset other rising prices to keep overall consumer prices relatively low. Some statistical slight-of-hand with inflation calculations and deliberately misleading reporting of inflation (i.e., emphasizing "core" inflation) has helped keep a lid on "reported" consumer prices as well.

Both of the first two factors, inexpensive energy and imports, are beyond the control of the Fed and are not likely to continue.

The Fundamental Error

The Federal Reserve has a three-part mandate for monetary policy - maximum employment, stable prices, and moderate long-term interest rates (it seems "maximum sustainable growth" used to be included here, but no longer). The fundamental error by the Greenspan Fed has been to make monetary conditions overly stimulative in order to facilitate job creation, while believing that it was achieving price stability.

While statistically, these mandates have largely been achieved in recent years, the failure to address asset prices and to consider the effects of trade and currency policies on import prices has enabled the creation of huge asset bubbles and trade deficits, while resulting in job creation of increasingly poor quality. The apparently mistaken belief that energy prices would stay low indefinitely will likely turn out to be simply a case of good timing for Mr. Greenspan and bad timing for his successor.

Collectively, these factors - asset prices, trade and currency policies, and energy costs - have painted a misleading picture of price stability, particularly over the last ten years, which the Fed has failed to recognize. Or, perhaps it has recognized these factors but has chosen to ignore them - for political or other reasons.

The failure to address asset prices and asset bubbles is well known - first stocks, now housing. These prices are not included in the consumer price indices, and this is, in part, justification for ignoring them as monetary policy considerations. The Fed says it is not their job to stop asset bubbles from forming, but rather to mitigate the effects of the bubble's aftermath. This is just nonsense, as will likely be demonstrated as the housing bubble aftermath develops.

The trade and currency policies of recent years have allowed huge trade deficits to develop with our Asian trading partners using what is essentially a fixed exchange rate system. While it is not the responsibility of the Fed to police other central banks and monitor the exchange rate policies of other countries, the Fed should be well aware that the absence of freely floating exchange rates has kept the prices of imported goods artificially low for many years. Instead of higher import prices due to a devalued U.S. dollar, this imbalance shows up in the huge trade deficit.

Finally, the relentless rise of energy costs in recent years brings with it the very real possibility that energy costs over the last twenty years were the exception and not the rule. While energy plays a smaller role in the overall price structure than it did two decades ago, it is still very significant, and if the price of oil continues to rise - to $80, $100, and beyond, as predicted by many - this will dramatically affect consumer prices.

It didn't have to be this way. Instead of recognizing these factors and formulating monetary policy accordingly, the Greenspan Fed has consistently eased monetary conditions for any and all reasons, in part justifying these actions by pointing to a set of mild inflation statistics or sounding the alarm for deflation, which under a non-fiat currency system is the natural by-product of productivity gains.

When looked at collectively, we can only conclude that the Greenspan Fed, for the last 18 years, has had a flawed mandate.


Also see:
The Yuan, the CPI, and the Fed
Benign Inflation
Is There a Housing Jobs Bubble?

Read more...

Watch the Yellow Line

Thursday, August 18, 2005

Like a giant aircraft carrier beginning a turn, huge rudders strain as they are moved to oppose the oncoming rush of water. The force is transmitted throughout the rest of the mammoth hull and the massive ship alters course.

On Tuesday, Dataquick reported Southern California housing sales data for July.

Not much happening really as far as the data and the charts go - kind of like that point in time in the game of musical chairs when it feels like the music is about to stop, and everyone slows down and looks at the chairs, then they look at each other, and the music continues to play.

Let's see, what other analogies can we apply here... how about we just look at the updated charts?

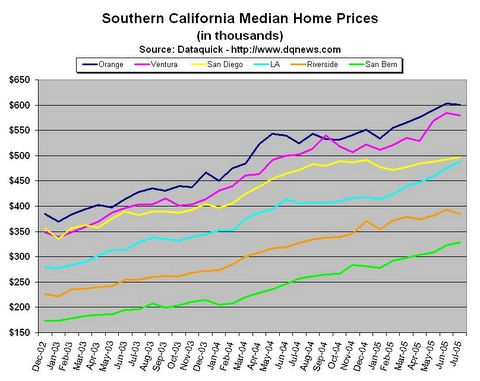
In the first chart we see median home prices for all Southern California counties for the last two and a half years. What's interesting here again is that yellow line representing San Diego. It is struggling to rise, and is rising, but very slowly in recent months.


Click to enlarge

It is clear from this chart how the year-over-year comparisons could get much more exciting starting next month, since the median home prices in August, October, and December of 2004 were $483K, $489K, and $491K, respectively. Last month the median price in San Diego was $496K.

Also, it looks like the Los Angeles blue line (not the train) will overtake the yellow San Diego line if current trends remain intact. For the last two and a half years there has been $50K to $75K separating the two. We have no idea why they are now converging.

There were three counties with month to month decreases, which is a bit unusual for the month of July. On this chart at least, month to month declines have been more common during August, December, and January. This gives the August data, to be reported next month, even more potential to surprise.

Year-Over-Year Trends

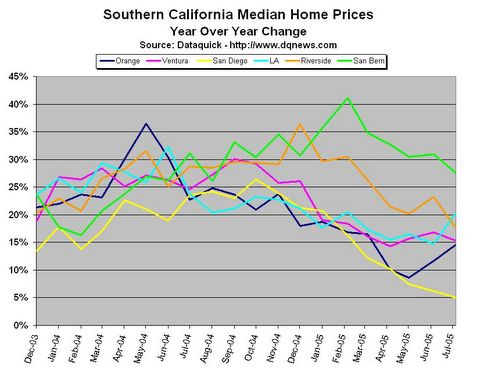
The chart below for year-over-year price change tells the same story it's been telling for a while now regarding the yellow line - nine months in a row of declining year-over-year price appreciation. Still positive at 5%, but headed lower. Would-be sellers who purchased a year ago, expecting another 25% annual price increase, are advised to consult a discount mortgage broker to improve their odds of breaking even.

So, it looks like San Diego is about to break into the low single digits, while Orange and Los Angeles counties buck the trend in a pretty big way. Recent big gainers in the Inland Empire are falling precipitously in annual appreciation - these should be watched closely in the coming months.


Click to enlarge

So, prices are still rising, volume has declined a bit, and inventory is way up, but people are obviously still buying homes these days - almost 5000 last month in San Diego alone. With all the media attention on housing booms and housing bubbles, especially in San Diego, just who is it that continues to buy? And, are they still using all those wacky loan products in order to qualify at today's sky-high prices?

We just heard on the radio that one-third of all recent home buyers in California are under the age of 35. This is the "Greenspan Generation" (the title of an upcoming essay), not afraid of any kind of leveraged speculation and sure that if something bad happens, there will be no long term consequences. And yes, there seems to be no let up in the number of wacky loans being originated.

What About the Media Coverage?

The housing bubble media frenzy really didn't get going in earnest until back in May, so it's possible that buyers who closed in July really didn't get the full impact of these news stories. Once your offer is accepted, you're thinking about draperies, paint colors, and termites - it's understandable how housing bubble stories would be quickly dismissed once all the ink dries on the purchase agreement.

Those buyers closing in the month of August, however, would have the benefit of about two months of the housing bubble media onslaught. Surely some people who were considering buying in June or July would have decided to just sit tight for a bit after doing just a little reading about real estate in the previous months. Then perhaps they would read a little more. How could you not come across at least ten or twelve stories about the housing bubble and the danger of risky loans during the months of May and June?

Or, are most home buyers still unaware of the potential downside to buying real estate today? Do they just continue to pursue the American dream of homeownership, without thinking about it too much?

The data for the next two or three months should prove to be the most hotly anticipated and intriguing of all housing data for the last few years.

Read more...

Inflation and Gold

Wednesday, August 17, 2005

Inflation ticked up a bit yesterday with the Consumer Price Index showing a year over year increase of around 3%. Then inflation ticked up again this morning, with the Producer Price Index showing a year over year increase around 4%.

These numbers would probably tick up a bit more, probably a lot more, if they more accurately represented what most people experience in their lives. But, we know how that works. None other than Alan Greenspan once lamented that savings is confiscated through inflation (see the main page side-bar quote from 1967).

We prefer to think of inflation as a stealth tax. Really, is there any difference between people sending their money to the government and people keeping their money as it loses its purchasing power as a direct result of government fiscal and monetary policy?

The real trick is to make people think that the money they keep isn't losing it's purchasing power. Or, better yet, a more believable story would be that it is only losing its purchasing power at a rate of two or three percent a year. That trick, the trick of the confiscators, seems to have worked quite well for some time now.

Pay no attention to the budget deficits, soaring debt of all kinds, or the increasing difficulty in making ends meet, and repeat after me, "inflation is benign", "longer-term inflation expectations remain well contained", "the breakeven TIP spread shows no inflation impact from oil", "the current cycle of non-inflationary prosperity can last for many years".

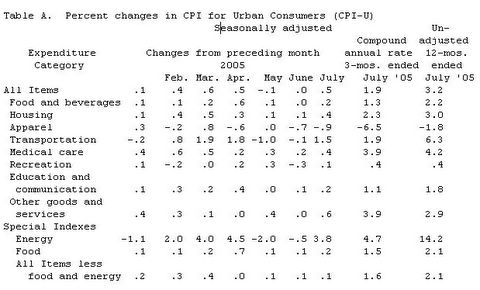
Here's yesterday's Consumer Price Index summary:


Click to enlarge

Examining the right-most column we find that total year over year inflation clocks in at 3.2%. Despite the 0.5% monthly increase, the inflation beast is apparently still heeding its master.

The sole negative number in the last column we understand - clothing, clothing accessories, and shoes are all going down in price and have been for at least the last ten years, as we discovered here. These low cost goods, manufactured overseas, help balance the cost of other, more expensive, goods and services provided by people in this country.

Transportation costs have gone up 6% in the last year, and energy costs have risen 14%. That doesn't quite explain how $1.80 per gallon gas is now closer to $2.50.

Or, how about that turkey sandwich in the cafeteria that used to cost $2.25 a couple years ago, then last year it was $3.00, and now it's $4.00. But food costs are only rising at the rate of 2% per year. That $2.25 sandwich should be more like $2.40, not $4.00.

And, housing is up only 3%, not 15% like you read in the papers. Does anyone else think that maybe if housing prices begin to decline and rents go up, that there will be a great realization that the housing component of the CPI needs to be re-jiggered to more accurately reflect housing ownership costs for the two-thirds of the population that own homes, rather than using "equivalent rent" which has been relatively flat in recent years?

Someday we will dig into this data some more, but until that time we don't believe what we are told - it doesn't jive with our own experience in the world, and if oil keeps doing what it's doing, at some point people will awake from their slumber and realize that their savings is being confiscated at an alarming rate, despite what the government statistics indicate.

Gold

In yesterday's post we forgot to mention Mr. Roach's passing reference to gold. It went like this:

Today’s nearly 6.5% US current-account deficit underscores America’s unprecedented external vulnerability in the midst of an energy shock. The more income-short American consumers keep on spending to defend their overly-indulgent lifestyles, the larger the US current-account and trade deficits are likely to be -- and the greater the possibility of an external funding problem that could result in a weaker dollar and/or wider cross-border spreads for US interest rates.

So far, only the dollar -- and possibly gold -- seem to be sniffing out this possibility.
We never think of gold as something that is "sniffing" anything. In fact, we are sure, there is no "sniffing" involved at all - gold just sits there, inanimate, waiting.

Waiting for another generation of smart people to rediscover its enduring value.

Read more...

Breaking Point

Tuesday, August 16, 2005

It's nice to see that Stephen Roach is back from his summer vacation. In the first paragraph of his first missive since returning to his duties at Morgan Stanley, he reminds us once again, why he is our favorite economist:

"On the surface, the global economy seems to be doing just fine. Yet just beneath that seemingly tranquil surface, the imbalances and tensions are only getting worse."
Yes, the recurring worry of all but the true believers and the supply-siders - what lies beneath the surface. What exactly is it that could be festering beneath the smooth outer layer of oft-repeated government statistics? That is, government statistics for the world's economic locomotive which paint a pretty macroeconomic picture of a healthy non-inflationary economy - 3.4% GDP, 5.0% unemployment, and 2.5% inflation.
"At first blush, there seems to be little reason to worry -- according to our US team, personal consumption growth is tracking a 5.5% gain in the current quarter. But consider the costs of that stellar accomplishment -- a personal saving rate that has finally hit the “zero” threshold, debt ratios that continue to move into the stratosphere, and asset-led underpinnings of residential property markets that are now firmly in bubble territory. Courtesy of surging oil prices, these costs are now at the breaking point, in my view."
So, zero savings, stratospheric debt, and a housing bubble when combined with higher gasoline prices and some big heating oil bills this winter could be a problem?

An interesting theory, but we're talking about the American consumer here. Surely the indefatigable American consumer can handle an extra 50 cents a gallon at the gas station.

Just the Beginning

Well, 50 cents may just be the beginning. Let's look again at the Matt Simmons interview with Jim Puplava over at Financial Sense Online:
MATT: ... we’re going to be lucky to get through the Summer without some periodic shortages. We probably will, but the odds are probably as high we will have some shortages, and then if we get through the Summer we have a fabulous respite from Labor Day to Thanksgiving, until we hunker down to try to figure out how the world gets through the Winter of 2005 and 2006 because oil demand globally could easily go to 86-88 million bpd during the Winter, and that could easily exceed supply by 2-5 million bpd.[38:53]

JIM: If that was to happen we would almost be looking at $75-80 oil, I suspect.

MATT: No, no, no. Oil prices could easily go up 5-10 times.
Hmmm... Five to ten times. That would make for some interesting gas price signs out at the curb, and some fascinating news stories.

We read the other day that the cost of oil represents 44% of the cost of gasoline. That would mean that today, all other things being equal, if gas is priced at $2.70 per gallon here in California, and oil were to double in cost, then the price of gas would rise 44% to $3.89. In a more severe case, but still not at Mr. Simmons' worst case scenario of a ten-fold increase in oil prices, if oil were to quintuple in cost, then the price of gas would rise 176% to $7.46.

Hmmm... $7.46 a gallon.

How Indefatigable?

This could really put a crimp in the lifestyle of a new homeowner. Consider the example of a couple who recently bought a home having stretched their purchasing power to limits that were unheard of just five years ago, with total allowable debt service of over 50% of gross income.

There's not too much left over at the end of the month, but that hasn't been a problem yet.

Now, let's factor in rising gas prices. Say the couple normally drives 12,000 miles each with an average fuel economy of 20 miles per gallon. This works out to be a total of 2000 miles or 100 gallons of gas per month. So, all other things being equal, if oil doubles in cost, the monthly gasoline bill goes up by $119, and if oil quintuples in cost, the monthly gasoline bill goes up by $476.

Ouch!

Of course the couple will probably drive less and maybe start carpooling, so the actual cost increase will not be as large as the calculations above, but at the same time, prices of all other goods and services that are dependent upon fuel costs will rise.

Combine these increased fuel costs with the effect of rising short term interest rates on adjustable rate mortgages or other debt service such as ever increasing home equity lines of credit (used more and more to purchase expensive gasoline) and it's easy to see how making ends meet could get increasingly difficult.

It's easy to see how this could be a breaking point.

Read more...

Things You See in Las Vegas

Monday, August 15, 2005

From the looks of the building cranes and housing billboards, there doesn't seem to be much of a slowdown in the Las Vegas housing market, but what do we know. Some of the billboards say, "From the $100,000s". We don't know what kind of new construction you could get for under $200,000 in Las Vegas, and, come to think of it, maybe it's best that it remain that way.

It's funny to look at some of the newer housing areas. With desert as far as the eye can see immediately behind a housing development, you have 2000+ square foot, two-story homes on tiny lots where it looks like neighbors could reach out their windows to shake hands. The American dream of your own single family home - wide open desert expanse right next to a jam packed housing area - just like Southern California, but more desert.

What's also funny is to compare and contrast the Donald and Ivana Trump condo sales offices, which are a couple blocks away from each other on the Strip. Ivana's got a huge sign on a tired street corner while Donald has a more subdued office in a primo location across the street from the new Wynn hotel. Our money is on Donald. That is of course, if either of these actually get built - 2008 is a long ways away.

It seems to be mostly Americans walking the streets and depositing money at the casinos - an occasional family from Europe or a couple from Asia. We wonder how the Las Vegas hotel and casino business will fare as American's feel less wealthy in the coming years - this could be an extreme example of how the wealth effect could work in reverse. Will the Chinese and other tourists from Asia pick up the slack? Probably not nearly enough to fill all those hotel rooms ... and condos.

If you want to understand more about recent Retail Trade job creation in America, go to the Las Vegas Outlet Center. It seems that
clothing, clothing accessory, and footwear retailers made up about 80% of the tenants and about 60% of them were hiring. Of course, most everything for sale is made in China, Pakistan, India, Nepal, or some other place half way around the world, but the good news is there are plenty of jobs available for American sales people. (The second chart from this post last week ­- Changes to U.S. Retail Trade Payrolls - now makes a lot more sense. We'd been to a Home Depot recently, but not to an outlet mall.)

There are more and more Spanish language TV and radio stations in the area. And, there are more and more advertisements for home equity loans, debt counseling, and the recent up-and-comer - bankruptcy specialists who will help you beat the October 17th deadline when the new bankruptcy bill takes effect.

Leaving Las Vegas

Q. What did the Escalade driver say to the Expedition driver as they filled up their gas tanks in Primm, Nevada?
A. Dude, gas is $3 a gallon.

In Baker, California, which is about 100 miles from anywhere, apparently there was a run on the number "3". That is, the number "3" that gas stations use to post their prices out by the curb. It was odd to see gas station signs that said $3.13, $3.23, and $3.33 for self-service gas - a clean sweep. One of the gas stations had to write in the number "3" in a couple different places using a Magic Marker - apparently they were unprepared for the most recent increase from their supplier.

Finally, a billboard in Barstow, California puts many of the previous observations into the proper context. A man in a nice suit is shown from just below his knees to his shoulders. Both pants pockets are pulled completely out, open palms facing those who drive by. Above where it shows the name and number of a local lender, in bold letters it says, "Time to Refinance?"

Read more...
IMAGE

  © Blogger template Newspaper by Ourblogtemplates.com 2008

Back to TOP