


![[Most Recent Quotes from www.kitco.com]](http://kitconet.com/charts/metals/gold/t24_au_en_usoz_2.gif)
![[Most Recent Quotes from www.kitco.com]](http://kitconet.com/charts/metals/silver/t24_ag_en_usoz_2.gif)
![[Most Recent USD from www.kitco.com]](http://www.weblinks247.com/indexes/idx24_usd_en_2.gif)
A Solid Foundation of Rising Asset Prices
Monday, August 07, 2006
Some of the best commentary from Paul Kasriel at Northern Trust comes on days when there are no economic reports. He and Asha Bangalore are usually on top of the economic news as it becomes available, giving it their own unique slant, however, on days when no economic news is scheduled for release, you find gems like this update to the personal savings rate.
In this commentary (.pdf) from a week ago, readers not only get a clear and concise explanation of the oft-misunderstood savings rate, but it also includes a neat chart going back almost 80 years to help put the current personal savings situation into perspective.
As is typical of Kasriel fare, an ominous warning or two come along at no extra charge.With the release of the second-quarter advance GDP data and the revisions to 2003 through 2005 data, we can update our household surplus/deficit chart. Based on first-half data, it looks as though households are on course to run yet another record deficit in 2006. To refresh your memory, we subtract from disposable personal income (after-tax income) the sum of expenditures on consumer goods/services and residential investment (value-added in housing). If households’ total expenditures are less than their after-tax income, then they are, in effect, running a surplus. This implies that they are advancing funds to other sectors – businesses, governments and/or foreign entities. If households’ total expenditures are more than their after-tax income, then they are running a deficit. This implies that they are borrowing from or selling assets to other sectors. In the first quarter of this year, households ran an annualized deficit of $566.2 billion. In the second quarter, this annualized deficit increased to $588.0 billion. Based on this first-half data, households are on course to run a 2006 deficit of $577.1 billion, which would break the 2005 deficit record of $476.7 billion (see chart below).
A concept as simple as spending less than you earn, in order to save something for the future, seems to have nearly vanished from mainstream thinking. With multiple asset bubbles now spanning a full decade, an entire nation and much of the Western world must now think that this is just the way the world works.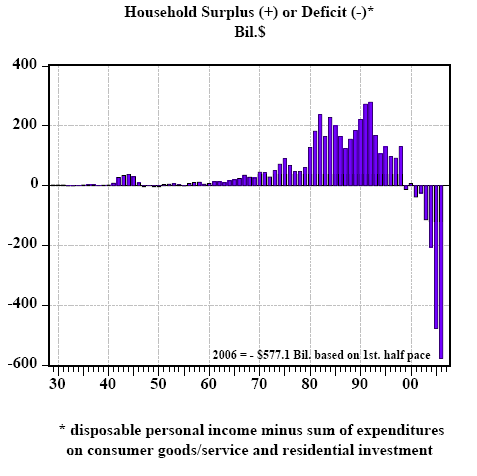 Assuming that households do, in fact, run a deficit for all of 2006, this would mark only the thirteenth time since 1929 that this has happened. Two years in which households ran a deficit were in 1932 and 1933 – the depths of the Great Depression. It is not hard to figure out why they might have run deficits then. With unemployment soaring, folks were selling assets and borrowing just to exist. Households again ran deficits in 1947, 1949 and 1950. Again, it is not too difficult to explain deficits in these years. During WWII, durable consumer goods and new houses were not available given that most production was being used for the war effort. And because there was not much to purchase for those working on the home-front during the war, they ran huge relative surpluses, to a large degree, in the form of war bonds. Soon after the end of WWII, with their balance sheets overflowing with assets relative to liabilities, households went on spending spree, buying houses, furniture, appliances and other consumer durables – hence the household deficits. Why households ran a deficit in 1955 is a mystery to me other than that was the year we bought the white-on-turquoise V-8 Ford.
This brings us to the “modern” era. With the exception of 2000, households have racking up large deficits starting in 1999. By the way, these deficits are not just records in absolute terms, but relative to their disposable incomes as well – e.g., 6.15% of disposable income in the first half of 2006. These “modern era” household deficits also are not that difficult to explain. Generational low nominal and real interest rates, in part engineered by the Fed, have had the effect of inflating the prices of assets – equities in the second half of the 1990s and houses in the first half of 2000s. Why should households spend less than their after-tax incomes when the value of their assets is skyrocketing? And, of course, with asset prices inflating, there is all the more collateral upon which creditors can advance loans. So long as asset inflation continues, we guess households can continue to run record deficits. We can’t wait to see how the adjustment works out when the asset-price music stops.
With the national housing mania clearly subsiding, the obvious question is, "What next?"
Another asset bubble?
Probably - the alternative is quite unpleasant just to think about.
Looking at the chart above a couple of thoughts come to mind. First, if one were to look at a similar chart for the 80 years prior to 1928, you'd probably be able to see the data for the entire period of time. In the chart above, running from 1928 to present, the dollar amounts have risen so dramatically that with the exception of the early 1940s, everything before 1960 looks like noise.
A similar chart for the 80 years prior to 1928 would look relatively level across the decades. With the exception of the Civil War, there was very little inflation during that period, the currency holding over 90 percent of its value, with little new printing of money. In the period since the formation of the Federal Reserve, the currency has lost over 90 percent of its value with money being created at rates never thought possible before.
The other item of interest in the Northern Trust graphic is that the 1980s will always be remembered for government deficits under Ronald Reagan, while American citizens still acted responsibly - continuing to save for a rainy day after generations of hard times and older, wiser relatives cautioning against excess.
Fast forward to the present day and, when combining rising asset prices with too few older and wiser relatives, American citizens have clearly lost their collective senses, opting to spend like drunken sailors with the apparent expectation that asset prices will continue to rise indefinitely.
As Mr. Kasriel comments, "We can’t wait to see how the adjustment works out when the asset-price music stops".

17 comments:
Maybe this deficit is the result of the first babyboomers retiring, who are now spending part of the vast surplus piled up over the past 20 years.
Yeah, I think everything's gonna work out just fine - don't sweat it.
hello from germany,
great reading. it is as simple as ist looks like.
you really wonder what most of the us is thinking.
we ingermany have a savingsrate around 8%. in part we haven´t had a bubble in the past 15 years and maybe our lendingstandarts are relative to the us very very tight.
jmf (germany)
http://www.immobilienblasen.blogspot.com/
jmf: Germany/the ECB does not enjoy the benefit of printing the world's reserve (and thus commodity and trading) currency, and as a consequence its currency has to be backed up with actual exports, even at the margin (and the unbacked margin of the USD is quite large).
This is what keeps lending standards tight, and why there are no GSEs (Freddie/Fannie) -- constant and instant refis work only when fresh money is constantly made available.
I suspect were the Euro to replace the USD (and Europe to replace the US as the consumer of last resort -- unlikely (hopefully) simply for physical/environmental limitations), it would have US-style finances.
jmf -- I think that with the 'right' loan officer, even an illegal immigrant German can obtain an insanely huge no-doc, no money down, interest only loan in the US.
Tim,
Does this chart real or nominal dollars?
Thanks
Another asset bubble?
Probably - the alternative is quite unpleasant just to think about.
Name any other asset that can effortlessly put tens (or hundreds) of thousands of dollars in the hands of over 2/3rds of the population while simultaneously generating millions of domestic jobs? There isn't any.
anon 10:15 - I believe these are nominal dollars
TJ - yes, real estate was the ideal asset to inflate, but if enough money is created to combat upcoming economic weakness, something will inflate somewhere.
The number that would seem to be most important is savings rate % (or debt level) compared to income level. Clearly this will not be uniform across the spectrum- i.e. the rich did not get rich by being bad with money. Thus, the mid to lower class numbers will be much worse off then these charts indicate.
great chart.
Its clearly caused by the invention of securitized loans. The securitization proccess has allowed the rich people of the world to loan money to us peasantly americans.
previously, american's didn't have enough money to loan to each other for this to even happen.
...something will inflate somewhere.
Yes, but to what effect?
Re: securitized loans
Actually, I'm not so sure rich people own a lot of those securities. It is more likely, we own them through our stock portfolios, pension plans and retirement funds. So, the securitization process has just enabled us to blow through a big chunk of our savings.
Seems like we're not comparing apples to apples here, in the sense that $1 bought more apples in 1933 than it does today. I would love to see what this chart looks like adjusted for inflation.
The best way to evaluate this kind of data is as a percentage of GDP. Then it is in the relevant context.
I would like to know your thinking on the inheritance baby boomers are to receive from their parents estates over the next decade and beyond. I've heard it said in conversation that the total amount is vast and will bail out a majority of debtors.
Good question - it's lots of money, but people are also living much longer too. The rich will have tons of money to pass on but ordinary folks will probably struggle.
If you look up statistics on reverse mortgages, you'll probably find an alarming number of retirees who are taking money out of their homes just to make ends meet - I've heard many anecdotal accounts of this.
Boomer inheritances: they will not be evenly spread! My wife and I expect get enough from each set of parents to put 1 kid through college, unless their final illnesses are very expensive, leaving us only needing to pay for the third. Swell for us. But an awful lot of boomers will get bupkis - especially those whose parents have been milking the HELOC machine for years.
Post a Comment