Wikinvest Wire

Paul O'Neill and John Snow

Friday, December 30, 2005

Having just finished reading Paul O'Neill's book from a couple years ago, The Price of Loyalty, it's natural to develop a completely different perspective of Treasury Secretary John Snow than one would glean from listening to him speak in public.


He has been routinely mocked in these pages (see here and here), and for good reason - he comes off as a buffoonish sort of caricature with big bushy eyebrows, who repeats the same talking points over and over.

When pressed for elaboration or some spontaneous thought that might inspire faith in the stewardship of the nation's finances, he always disappoints.

Listening to he and Alan Greenspan sit side by side during Congressional Testimony was a sight to behold - the Treasury Secretary would never veer from what sounded like a prepared script, while the Fed chairman would wax eloquently for many minutes at a time, informing and amusing, while sometimes confounding his audience.

The Economist Magazine has referred to the Treasury Secretary as a traveling salesman:

In theory, Mr Bush's economic team is headed by John Snow. The president was on the point of sacking his treasury secretary at the end of last year; he then pulled back—but only apparently to keep Mr Snow as a travelling salesman for his pension-reform scheme. The former railroad boss has recently visited such well-known global financial centres as San Antonio, Albuquerque and New Orleans.
But, after digesting Mr. O'Neill's tome, Mr. Snow's approach to his job now seems clear.

About three years ago, when asked by the Bush administration if he wanted the job of Treasury Secretary, Mr. Snow must have rightly figured, "Well, if it's not me they'll find someone else to just parrot what the inner circle wants, and history will blame Bush and Greenspan for this mess anyway, so why not be Treasury Secretary for a few years and allow all my descendents to talk about me like I was another Alexander Hamilton".

There are many accounts in The Price of Loyalty where an outspoken Secretary O'Neill was taken to task for not promoting the party line. For example, speaking honestly about issues such as the "strong" dollar policy and working with Alan Greenspan to craft "triggers" for tax cuts. He remarked on more than one occasion that "cutting taxes is not an economic policy" and bristled when told that "deficits don't matter".

In the end, balking at the last round of tax cuts proved to be his undoing, but it sounded like he had one foot out the door anyway. His recollection of Christine Todd Whitmann and Colin Powell as the other square pegs was particularly enlightening and the continuing absence of what he called an "honest broker" within the inner circle goes a long way in understanding many White House decisions.

It's not clear how much of this John Snow understood when accepting the position of Treasury Secretary about three years ago, but the White House seems to have gotten exactly what they were looking for - another "yes man".

We have a newfound respect for our Treasury Secretary.

Read more...

To the Limit, and Beyond

Thursday, December 29, 2005

Really ... what's the point in having a limit if it is routinely raised when it is about to be reached? That's not really a limit at all, is it? That's more like just a number that increases over time. Limits are intended to stop something. As Merriam-Webster would have you believe, a limit is "something that bounds, restrains, or confines".

For example, a speed limit is supposed to stop people from driving faster than a certain speed. Most drivers observe this limit, or what they infer to be a more reasonable and still "mostly" legal limit of the posted rate plus six or eight miles per hour.

This system works fairly well.

Credit card limits work fairly well also. For example, the credit requested on presentation of an Amex card is either granted or declined based on where the new total indebtedness falls relative to the previously established limit. You can always ask your credit card issuer to raise your limit - sometimes this works, sometimes it doesn't.

But, what is one to discern from the Federal Government "debt limit" in recent years?

It was last raised in November 2004 from $7.4 trillion to $8.2 trillion dollars. Today, Treasury Secretary John Snow has alerted Congress that we are expected to finish spending this newly borrowed $800 billion by mid-February, and the limit once again must be raised.

At some point you've got to wonder who's going to start whittling down the outstanding balance on this debt.


OK, we all know the standard answer to that question ...

It also makes you wonder about that $317 billion budget deficit that many were crowing about a few months back - a 22 percent reduction in the fiscal 2005 budget? That doesn't square very well with new borrowing of $800 billion in 15 months. Some of the answers to this riddle were discussed in these pages some time ago when we had Fun with the Public Debt.

Raising the debt limit has become routine. It's as if you make minimum payments on your credit card every month, and then when you reach your limit, you call the credit card company and ask them to raise your limit.

And, they do!

About once a year - year after year after year. The outstanding balance continues to go up, with little or no payments toward the principle, but new credit is extended.

Of course it helps when you own a printing press. This way, the debt can be "monetized", which is a fancy way of saying that the Federal Reserve buys U.S. Government debt with money printed "out of thin air".

This is, at times, very convenient.

Recently, our Asian trading partners have purchased so much or our debt that "monetizing the debt" by the Federal Reserve has not been required as much as in the past.

Where do they get the money to buy U.S. debt?

This is "extra" money that they have laying around, apparently. A "surplus" of savings is what they call it. But our trading partners also own printing presses, and many of them fix their currencies to ours, so it seems that they have to operate their printing press each time hard-working Asian businessmen want to exchange U.S. dollars for their local currency.

Printing presses ...

In some ways, owning a home is kind of like owning a printing press.

As long as home prices continue to go up, you can always borrow against your house to make ends meet - to perpetuate a lifestyle that you really can't afford.

In an odd sort of way, this is much like borrowing money from Asian trading partners who are content with debasing their currency at a rate equivalent to the rate that you are debasing your own currency.

As long as the trading relationship continues, you can always borrow from your trading partners to makes ends meet - to perpetuate a lifestyle that you really can't afford.

Read more...

Happy Holidays!

Thursday, December 22, 2005

We will soon leave for Northern California to visit family and friends, play in the snow, and scout out some more possible retirement locales. Look for the next post sometime around the first of the year.

Thanks to regular readers of this blog, as well as passers-by, for all the kind words and support over the last year. Look for more of the same next year, along with a few surprises.

Wishing you all a pleasant holiday season and a prosperous new year, we leave you with a few wintry photos of one of our favorite parts of the Sierra Nevada Mountains - Calaveras Big Trees State Park.


Click to Enlarge


Click to enlarge


Click to enlarge


Click to enlarge

Read more...

No Deal

Wednesday, December 21, 2005

Viewing NBC's new game show Deal or No Deal offers further evidence that the decline of Western Civilization is accelerating. While initially fascinated by the statistics and probabilities that are integral to the show, this emotion quickly gave way to the more overwhelming feeling of shame.

Shame that the Bread and Circuses in American society today are converging at a quickening pace.

Many years ago, when television was still in it's infancy and America was a net exporter and creditor to the world, What's My Line entertained the populace (a Mark Goodson and Bill Todman production - one of many).

Celebrity panelists tried to guess the occupation of contestants who would win a small cash prize if they were successful in stumping the panelists after a series of yes or no questions. It was entertaining and it was all in good fun.

Times sure have changed.

Back in 1999 when Who Wants to be a Millionaire debuted in the U.S., at least contestants had to answer questions. There was some skill involved - not completely a game of chance.

And, on Survivor, people actually get injured and vomit and otherwise become physically unable to continue in the competition.

NBC's Deal or No Deal has dumbed down prime time game shows to levels few could have imagined while at the same time offering huge sums of money and plenty of excitement.

It is strictly a game of chance, with a focus on the emotions experienced by a family making joint decisions involving sums of money that are multiples of the median family income.

If a contestant is lucky enough to make it onto the show and get selected as a contestant, they pick numbers and then make decisions to either take the $90,000 currently offered or risk it on maybe winning the half million.

Just by picking numbers - randomly.

With each round, the calculation changes - take the $68,000 or the shot at a quarter million.

Those familiar with games of chance will quickly deduce that all the offers coming down from the mysterious banker on the second floor are cold, hard calculations based on probabilities and the business plan for the television program.

[For some odd reason the mysterious banker is seen reviewing a print-out of something, when in fact all he really needs to do is punch in a few numbers on his PC and hit return.]

The excitement is all about the reaction of the family when confronted with decisions involving life-changing amounts of cash.

Bold or conservative, risk-taker or risk averse. In either case, the family must be animated. The populace must be entertained.

[As the holidays near, it is imperative that we offer something positive in this space - we will see what can be done in the coming days.]

---------------------------

UPDATE (8:12 AM PST)

Slate has this to say:

When last a prime-time game show became a national sensation, the year was 1999, the Nasdaq index was doing ridiculous things, and Regis Philbin was spawning an appallingly viral catchphrase ("Is that your final answer?!"). Who Wants To Be a Millionaire was the right circus at the right time; a little knowledge and nerve could bring Joe Average a lot of dough. Deal or No Deal, which debuted to strong ratings on Monday night and runs all this week (NBC, 8 p.m. ET), is the opposite of a quiz show and does not require even the modest deductive skills of Wheel of Fortune. Its central theme is self-restraint.

Each contestant ascends to the Deal or No Deal stage to stand opposite 26 models in identical cocktail dresses—Barker's Beauties by way of Robert Palmer's "Addicted to Love" babes—each of them bearing a briefcase with a different dollar figure inside. The contestant selects one of the cases. There could be a penny or a million bucks or any of 24 figures in between; none of us will know until the end of the game, which is an exercise in game theory. The contestant opens the remaining briefcases, a few at a time, to find that hers was not the one with $5 or $500,000 or whatever within. Based on the dollar figures removed from contention, "the Bank," the shadowy embodiment of a mathematical model, relays "offers" through Mandel. The Bank will give the contestant a wad of cash in exchange for her chosen case. Will the player opt for the none-too-shabby guaranteed sum or take her chances? Deal or no deal? These offers fluctuate with the apparent odds. The contestant walks away with a jackpot or chump change or perhaps a midrange sum good enough for buying a new sedan.

Despite that twisty description—and despite its appropriation of Millionaire's ominous synthesizers and Star Trek's set design—Deal or No Deal is clean and minimal. Though it does a fine job of building tension slowly, I suspect that it has become a smash hit in more than 30 countries because it is good to yell at. In concert with the studio audience, you get to berate the contestants as they succumb to temptation and push their luck or bless them for checking their greed. If the show takes off, America will have discovered a new spectator sport: caution.


Read more...

Enron and Home Equity Wealth

Tuesday, December 20, 2005

Sometimes when a trend continues for a long enough period of time, people come to accept the trend as just another fact of life. Despite initial skepticism, if events continue to unfold in the same manner month after month, year after year, people tend to forget their initial misgivings.

After repeated positive reinforcement, new beliefs become entrenched and the current reality is projected into the future. Regardless of its enduring qualities, what at first seemed unbelievable, becomes believable over time.

Enron

Enron is a good example of this phenomenon. Living in California during the rolling blackouts of 2000 and 2001 and reading news reports about the energy crisis, it became clear that Enron had mastered the business of trading just about anything that could be traded.

With a partially-deregulated energy market, the State of California and its hapless Governor were hopelessly outclassed by savvy Enron traders - Enron's stock soared as California's lights dimmed.

Named "America's Most Innovative Company" by Fortune Magazine, Enron traded such exotic items as internet bandwidth and weather derivatives while earning record profits. They led the way with sophisticated financial instruments such as derivatives and employed innovative accounting practices such as special purpose entities.

At the height of their success in late 2000, as the NASDAQ stock market bubble was bursting, Enron's star shone bright. At the end of 2001, things began to unravel quickly, and in 2002 the company was exposed for what it was - a fraud.

Stock and bond holders were aghast, as the entrenched belief of Enron success was laid bare to reveal few enduring qualities. Vindication for California's governor was much too little and came far too late.

Home Equity Wealth

Like Enron's rise in the late 1990s, the rise in home prices in many parts of the country has occurred over many years - until recently, it has been a gradual process. In 2001 and 2002, as the Enron meltdown progressed, mortgage lending rates plunged, spurring wave after wave of home refinancing - home prices began to rise more quickly.

Slowly, year after year, millions of homeowners became accustomed to rising home prices, and they became more aware of the latest "market value" of their home. Initially, many homeowners reacted to this simply by feeling more secure in their financial condition.

An "equity cushion", as Fed Chairman Alan Greenspan has called it, had begun to grow larger, faster, and that made household balance sheets more secure - job loss or family emergencies were no longer viewed as devastating financial events because an increasing amount of "emergency money" was there at the ready.

A year or two later, as home prices rose more quickly, a funny thing started happening. Long time homeowners of otherwise modest means, began driving nicer cars and taking better vacations.

Everyone seemed to be remodeling something - additions, swimming pools, landscaping, granite counter tops. Rising tuition costs were less of a problem and elective medical procedures became more and more common. People ate out more often.

Soaring real estate prices over the last few years combined with the newfound ease of home equity withdrawal have led many homeowners to spend money like they've never spent money before in their lives. When measured by consumption and the material goods that they have acquired, these homeowners have become "wealthy" far beyond what they could have imagined just five or six years ago.

Their standard of living has markedly improved.

But, excluding the market value of their home, many of these newly "wealthy" homeowners have a balance sheet that is in worse shape than it was just a few years ago - newly purchased goods lose value quickly after their purchase. It is only with high and still rising home values that overall net worth remains substantial, as wages have risen at a sluggish pace, many have discontinued saving, and other expenses have continued to rise.

The positive reinforcement of rising home prices over a period of years has caused many homeowners to believe that rising home prices, or at least the current value of their home, is something that can be projected into the future. And why not? Nothing in the last ten years would lead anyone to believe that home prices do anything but go up.

What If?

But what if the real estate market of 2005 turns out to be a lot like the energy trading market of 2001?

After many successful but unspectacular years, Enron rose toward the heavens on the back of "new era" thinking. Within a period of just a year during 2001-2002, they failed spectacularly causing much anguish and pain for many who became true believers on the way up.

In the end, their business model was revealed to be fundamentally flawed - it was fraudulent and unsustainable.

There are those who argue that the business model behind today's real estate market is fundamentally flawed. Derivatives offsetting risk in asset backed securities are new and innovative. And, when 82 percent of home purchase loans in the state of California last year were either interest-only or negatively amortizing loans, that should cause potential homebuyers to question the prices that are being paid these days - to question how sustainable current real estate trends are.

But beliefs about real estate and home equity wealth are now entrenched after many years of positive reinforcement. Beliefs change slowly, and most people are reluctant to cast doubt on something that has been so good to them over the last few years.

Like the hourly Enron worker with a million dollar retirement account in 2001, the hourly California worker with a million dollar home in 2005 looks to the future with every expectation that what they've come to believe in recent years will continue.

Read more...

The Yield Curve

Monday, December 19, 2005

The flattening of the yield curve has been much talked about lately and there will be plenty more talk in the coming months. For those new to this topic, the yield curve is most often represented by a chart with U.S. Treasury yields of varying durations - shortest on the left, longest on the right - at a particular point in time.

Readers are again directed to the always informative Dynamic Yield Curve over at StockCharts.com, where many hours can be spent investigating some of life's economic and financial mysteries.

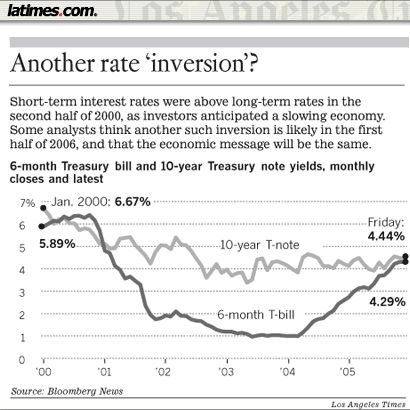
To the left is the yield curve as of March of 2003, around the time that U.S. equity markets hit their lows for the decade. Economic growth, as measured by real GDP, had gone negative for a few quarters in 2001 and 2002, and heading into 2003 was uncomfortably in the two percent range.

To make matters worse, job creation was anemic and people were talking about the dreaded "deflation" monster.

Still reeling from the stock market bubble and the 9/11 tragedy, growth, job creation, and inflation were much too low for the folks at the Federal Reserve.

While long term rates have held generally above 4 percent in the last few years, the 10-year note occasionally dipping into the 3 percent range, the difference between short term rates and long term rates has been at least two or three percent during this time.

This is a highly stimulative condition, as with no apparent limit to the amount of money available to be borrowed, many have seized the opportunity to borrow at low short-term rates, seek a higher return elsewhere, and pocket the difference. This is otherwise known as the "carry trade".

This has worked well in the U.S. until short term rates began rising last year - today it only works well in Japan, where short-term interest rates have been near zero for the better part of the last fifteen years, following the zenith-like rise of their economy in the 1980s.

To the right is what the yield curve looks like today. The difference between long-term rates and short-term rates has narrowed precipitously since June of last year as short term interest rates have moved from 1 percent to 4.25 percent in a series of 13 quarter point hikes. During this time rates for the 10-year Treasury actually fell from 4.6 percent to 4.4 percent.

Thus the conundrum.

Why have long-term rates refused to move up as short-term rates have risen?

Why is this a conundrum? Why is this significant?

Because a continuation of the current trend will cause an inverted yield curve.

What's Wrong with an Inverted Yield Curve?

An inverted yield curve has been the single most reliable economic indicator in predicting coming weakness in the economy - it has, in fact predicted the last five recessions. In an article from yesterday's L.A. Times, Tom Petruno explains:

Normally, long-term interest rates are higher than short-term rates, which makes sense. If you're going to tie up your money for a lengthy period you would expect to be compensated for the risks that entails.

When short-term rates exceed long-term rates, an "inversion" is said to occur. The last one was in 2000: The Fed held its key rate at 6.5% in the second half of that year. But as the economy weakened, bond investors began to sense that the Fed soon would be easing credit. Long-term bond yields slid.

By the end of December 2000, the 10-year Treasury note yield was 5.11% — about 1.4 percentage points below the Fed's short-term rate.

The Fed began cutting its rate in January 2001, but it was too late. A recession began in March.

That has been par for the course, according to David Rosenberg, an economist at Merrill Lynch & Co. in New York. In the last three decades there have been five Fed-induced rate inversions, Rosenberg said.

"The economy slipped into recession a year later all five times," he said.
Hmmm...

"Too late" in cutting rates and "Fed-induced" rate inversions leading to recessions - that's not something that you hear a lot about. The Fed is supposed to be assuring things like price stability, maximum sustainable growth, and full employment, not "inducing" recessions by cutting rates too late.

In fact isn't "inducing" a recession really the domain of 1980s Fed Chairman Paul Volcker? Does anyone think of current Fed Chairman Alan Greenspan as inducing recessions? There have been so few recessions in the last 18 years, and comparatively mild ones at that.

But, back to the yield curve...

Given the course that has been taken for the last year and a half, and should current trends continue, an inverted yield curve would likely appear sometime in the first few months of 2006, as short-term rates move up to between 4.5 and 5 percent. It's been almost four years since the ten-year note was over five percent, and it shows little inclination of late of cooperating anytime soon. It seems the only way to avoid a rate inversion would be to stop raising short-term rates.


But, maybe this time it's different. Maybe an inverted yield curve in this new era of global trade and international finance is not such a big deal. The L.A. Times article continues:
This time around, however, no less than Fed Chairman Alan Greenspan himself has said that an interest-rate inversion might not signal an economic slowdown. The implication is that the bond market has its own special issues these days.
...
Some on Wall Street believe that demand for bonds has remained robust, keeping yields down, because of a global savings glut — meaning that so much money is looking for a place to go that investors in effect are forced to out-compete one another for bonds, depressing returns.
"So much money is looking for a place to go" - now on the surface it sounds like there could be a lot worse problems than having too much money. And, there is no question that U.S. debt is popular with our overseas trading partners, who coincidentally, on a monthly basis, have just about exactly the same amount of new savings as the U.S. has new debt. That is very convenient for a nation such as the U.S. that would much rather spend than save.
Some analysts also contend that bond yields have softened because the market believes inflation has been vanquished in the long run, the jump in energy prices notwithstanding. Government bond returns have averaged 2.3 percentage points above the inflation rate since 1926. If inflation falls back to, say, 2%, a 4.44% bond yield would look fairly generous.
So much money but so little inflation - inflation has been "vanquished in the long run" - a savings glut and low long term interest rates to keep mortgage rates low to enable the continuation of the world wide real estate boom.

Again, it's hard to see where the problems are here. What is everyone concerned about with this inverted yield curve?

It appears that we are living in the most perfect of all possible worlds. The only thing that doesn't make sense is why gold is rising so dramatically.

Read more...

All Good News, All the Time

Friday, December 16, 2005

The good news has been so overwhelming of late, and our futile attempt to cast aspersion on the data supporting the good news has been so ineffective, today we explore a different tack. While changing the name of this blog to something like "The Marvel that Greenspan Made" would be both labor intensive and perhaps premature, a simple experiment with today's fare, in the form of a week-in-review, may prove illuminating to both writer and reader.

And, maybe not.

Federal Reserve Policy Meeting

On Tuesday the Federal Reserve continued tightening credit, hiking the federal funds rate another quarter point to 4.25 percent, the highest level since early in 2001. Dropping the word 'accommodative' and altering the use of 'measured', the policy statement accompanying the rate announcement was widely viewed as a preliminary signal that the rate-raising cycle would soon end.

While the language signaled further rate increases in the near future, most market observers concluded that in light of reduced inflation fears in recent weeks, longer-term policy will be more equally balanced between price stability and economic growth. The stock market reacted very positively to the change in wording; the Dow Jones industrial Average rallying nearly 100 points immediately after the policy statement was released.

It is clear that Alan Greenspan, in his second to last open market committee meeting as Fed Chairman, has deftly maneuvered monetary policy stance to an idyllic state in preparation for next month's handover to incoming Chairman Ben Bernanke. The touch that has been demonstrated leading up to this transition has been wondrous to behold. Mr. Bernanke will be in The Maestro's debt for years to come - with robust GDP growth, low inflation, and full employment what more could any incoming Chairman possibly want?

Inflation Once Again Under Control

The Labor Department reported yesterday that consumer prices dropped 0.6 percent during the month of November, the largest monthly decline in over 50 years. Energy prices declined 8 percent, led by a drop of 16 percent in gasoline prices, accounting for most of the overall decline. The year-over-year change for all items in the index totaled 3.5 percent, down markedly from the annual rate of the 4.7 and 4.3 percent in recent months.

"Core" CPI, which excludes the volatile food and energy categories, rose at a 0.2 percent rate for the month with a year-over-year change of 2.4 percent. Analysts noted that rising energy prices have not fed into "core" inflation, which has remained stable in recent months as wildly fluctuating energy prices caused the overall rate of inflation to rise from under 3 percent to almost 5 percent at its peak, then back to 3.5 percent in November.

The stability of the "core" rate of inflation bodes well for the economy. Price stability is central to current monetary policy decision-making, and as economists and the financial media continue shifting the focus of inflation reporting away from the higher "all-items” rate to the more benign "core" rate of inflation, the prospects for continued robust economic growth are increased.

Some analysts warned that rising foreclosures and a cooling housing market have recently put upward pressure on home rental costs which have been used in place of actual home prices for over two decades, effectively suppressing core inflation. Accounting for 30 percent of core inflation, some observers suggested that should rising rental prices feed into core inflation, the Bureau of Labor Statistics may once again revise the calculation methodology to more accurately reflect the benign inflation environment to which the nation has become accustomed.

Real Wages Rise (from guest blogger John Snow)

Following on last week's record household wealth levels and a 0.5 percent increase in real hourly earnings in October, today's announcement that inflation adjusted hourly wages grew 1 percent in November is welcome news for America's workers and another sign of the strength of the U.S. economy.

One way to look at the health of the economy is to view where we are compared to previous business cycles. Real hourly wages are up 1.1 percent versus the previous business cycle peak in early 2001. That means workers are today earning more per hour in real terms than they did at the height of the 1990s expansion. By comparison, at the same point in the business cycle of the 1990s, real hourly wages were down 2.1 percent.

When the ingenuity of American workers and entrepreneurs is free to create and innovate, the result is economic growth and higher standards of living. That is why it is so important that we keep in place President Bush's economic policies of lower taxes on individuals and investment. These policies, combined with sound monetary policy from the Federal Reserve, have set our economy on the right course of sustained economic growth.

Higher real wages, combined with 4.5 million new jobs created since May of 2003 and GDP growth that has averaged 4.1 percent, with 4.3 percent growth in the most recent quarter, gives us much reason for good cheer in this holiday season.

Gold Continues Its Slide

Gold futures continued their retreat from 24-year highs earlier in the week, dropping another $3.20 to close at $503 yesterday. Analysts said the market remained volatile as overbought conditions were quickly corrected in a matter of four trading sessions, driven largely by activity on the Tokyo exchange.

Earlier in the week, Japanese monetary authorities doubled margin requirement for speculative trades spurring massive selling of futures contracts at the TOCOM exchange. This resulted in daily price limits being enforced halting the slide, however, analysts indicate there could be more downward price action as more Japanese investors sell in the coming days.

Investors had been buying gold as a hedge against rising energy costs and other inflationary expectations, however, in recent days, these fears have proven to be unfounded. As Fed Chairman Alan Greenspan has famously stated, "The inflation rate, properly measured, at this particular stage, has been very close to zero for a very long period of time."

Look for the 2005 gold price movements to become but a footnote in history, as gold once again retreats to its proper position of irrelevance within the world's monetary system.

Southern California Home Sales Report

Southern California home prices set new records again last month and sales remained near historic highs, Dataquick reported Thursday. Strong demand and the expectation of rising interest rates combined to spur sales, just as many observers had been expecting sales volume to slow and prices to moderate.

The median price paid for a Southern California home was $479,000 last month, up 15.4 percent from November 2004. Yearly price gains by county ranged from 6 percent in San Diego to 23 percent in San Bernardino, demonstrating solid support for current price levels, with the possibility of renewed acceleration in appreciation as sales volume returns to normal levels next spring.

While affordability using traditional mortgage products is at new all-time lows, buyers have embraced many of the financial industry's most innovative new loan products in order to purchase homes they otherwise could not afford. As more untraditional mortgage products become available, analysts project median home prices in Southern California will top $1 million by the end of the decade.

This Week's Recommended Reading

Our Brave New World by Charles Gave, Anatole Kaletsky, and Louis-Vincent Gave

Read more...

Fool Me Twice ...

Thursday, December 15, 2005

Now that the Bush administration has taken the advice of conservative legislators and Wall Street economists to proudly herald the dawn of a new era of sustained economic growth, it seems reasonable to take a closer look at the data being used to draw those conclusions - to see how the case is being made.

After the foreign policy adventures of the last few years, perhaps more people should think twice about the conclusions being offered regarding our economy - to question whether selective data is being used or if anything is being distorted in any way.

Yesterday, on the same day that the trade deficit set a new record and it was announced that risky mortgages could be harder to get, Treasury Secretary John W. Snow, Commerce Secretary Carlos M. Gutierrez, and Labor Secretary Elaine L. Chao gave a year-end briefing on the American economy without once mentioning the word "deficit" or "debt" in their prepared remarks.

That shouldn't be surprising - the trade number is a bit embarrassing, and cutting back on "risky lending" may impact the much trumpeted "household wealth" figures, should it turn out that current real estate prices can't be supported with loans that aren't so risky.

Treasury Secretary Snow commented:

As we look back at our economy's strong performance over the last year, Americans have a great deal to be proud of and every reason to be optimistic about the future. More Americans are working than ever before – with nearly 4.5 million jobs created since May of 2003 – the economy has been expanding steadily by more than 3% for 10 consecutive quarters; and household wealth--the value of people's savings and homes--is at an all-time high.
...
We have every reason to believe that our path of growth and job creation will continue. We are looking forward to continued robust growth in payrolls and, as headline inflation recedes, real wage growth. I'd also expect to see continued GDP growth in the range of what we've seen over the past couple of years.
Isn't the savings rate negative? How can household wealth - savings and home values - be at an all-time high if savings is going backwards? Isn't household wealth really all about the home prices?

Secretary Gutierrez echoed many of Secretary Snow's comments regarding job growth, robust GDP, and tax cuts, and then Secretary Chao had these prepared comments about job creation:
Equally important is the widespread nature of the job growth, as this slide shows. Sectors gaining jobs included construction and the skilled trades, healthcare, professional and business services, and transportation.

Since May 2003, the fastest growing sector has been professional and business services, which added more than 1.1 million jobs. Health services have also been a leader with 777,000 new jobs. Employment in construction has grown by 660,000 jobs and is at an all-time high with 7.4 million workers.
Widespread job growth and the skilled trades? Having looked at the labor data long and hard, there is no "skilled trade" category. What Ms. Chao must be referring to are the "specialty trade contractors" that are part of the construction category - the folks that affix new drywall in support of new home construction and of course the granite countertop installers.

Ms. Chao is correct about professional and business services being the fastest "absolute" growth major category - that is clear from the chart that accompanied the talks. This chart and many more are available here (warning - .pdf)


Click to enlarge

Now, at this blog, we've fooled enough with the Bureau of Labor Statistics data (the historical data for the 'B' tables to be specific) to immediately realize that there is something wrong with this chart and these words. They didn't pass the smell test for a nose that has been sniffing around the BLS data for a while now - a fair amount of analysis and mostly serious commentary has been offered:

The Quality of the Jobs
Trade and Transportation Jobs
One Last Look at the Jobs Data

So, what's wrong with the chart? The problem with the chart used by Ms. Chao, is that it has left out a number of very important explanations and a number of very important job categories.

First, the timeline starts in May 2003 which was the last bottom in the job market. Fair enough. You can't do that with stocks, but you can do it with jobs - pick the point in time that gives you the best results.

Next, the bars on the chart add up to 3.1 million jobs, but the total number of new jobs is stated as 4.5 million elsewhere - repeatedly. What's the difference? There are about 300,000 new Government jobs and about 300,000 fewer Manufacturing jobs. This is a wash, unless of course you used to work at a manufacturing job and were not able to land one of those new government jobs.

There are also two smaller categories which are not shown on the chart either. These are largely insignificant in the big picture - Natural Resources and Mining along with Other Services.

But, there are still over a million jobs to account for. Where are they? Well, it seems that jobs corresponding to nearly the entire consumer economy are absent from the chart.

Huh?

While shopping and dining out may be good enough for the GDP charts, they seem to have been cast aside for the job creation chart - maybe like the crazy aunt that lives in the basement.

They have been conveniently inserted into this updated chart:


Click to enlarge

The very first category in Ms. Chao's chart, Transportation and Utilities, is actually part of the major category Trade, Transportation, and Utilities, which also includes Wholesale and Retail Trade. This would be new jobs at Wal-Mart and Home Depot and at all those outlet malls around the country that people just can't seem to get enough of.

While the rate of increase for these Wholesale and Retail Trade positions has slowed from the pace of a few years ago when home equity extraction first became a national pastime, it still accounts for a significant number of new jobs since May of 2003 - a lot more than the Utilities category, to be sure.

But, our favorite jobs category of all, and the one most representative of the U.S. economy today is the Food Service and Drinking Places category (part of Leisure and Hospitality), which clocked in with a 7 percent growth rate and nearly 700,000 new spots - more than the Professional and Business Services category if you subtract out all the temporary jobs, which now contribute a historically high percentage to this category.

So, why were Retail Trade and Food Service omitted from the chart?

Our guess is that they just don't look good and this briefing was all about shaping perceptions.

We'll have to take a closer look at some of the other charts now - especially the one that says that 63 percent of all new jobs pay above average wages.

That one really looks interesting.

Read more...

The Billionaire Pessimists Club

Wednesday, December 14, 2005

We've heard many times from Warren Buffet about the difficult road ahead for the U.S. economy - the dollar, the perils of living in Squanderville, and the ascendant Sharecropper Society are his most notable objections to the rosy picture painted by Wall Street economists and government officials.

Even Mr. Buffet's much younger, slightly richer, sometimes side-kick, and occasional bridge buddy Bill Gates has been rather down on the dollar lately due to rapidly accumulating debt and the plethora of promises made by the U.S. government.

George Soros and Jim Rogers of Quantum Fund fame are bearish on Bush economic policies and bullish on commodities, respectively. Both of these views bode ill for the American way of life as it has been known for the last half century. That is, the American way of life for most of the citizenry - for the upper few percent of the populace, rising energy and raw material costs are more than offset by a reduced tax burden.

Sir John Templeton has been predicting a U.S. real estate disaster for some time now, and Bill Gross at Pimco has likened the current state of affairs to Rome burning, and much worse.

What do all these gentlemen have in common?

They are all billionaires, they all speak freely, and they all have very serious concerns about the course that the nation's economy has charted.

Is anyone listening to them?

Very few - clearly, not enough. Maybe if there were more billionaires out there talking about issues like this, they could really make a difference. But who? Don't look for the Walton clan of Wal-Mart fame to start talking, or Larry Ellison of Oracle, or Michael Dell of Dell. They don't want to ruin the good thing they all have going.

And certainly don't look for Oprah Winfrey or Donald Trump - they are likely weak on macroeconomics in general and global imbalances in particular.

Just when it looked like the outspoken "Billionaire Pessimists Club" was beginning to lose their momentum, along comes Richard Rainwater.

Richard who?

Good question. Appearing in the current issue of Fortune Magazine, meet Richard Rainwater, billionaire pessimist, dour survivalist, peak oil alarmist, and new hero to this humble blog:

Richard Rainwater doesn't want to sound like a kook. But he's about as worried as a happily married guy with more than $2 billion and a home in Pebble Beach can get. Americans are "in the kind of trouble people shouldn't find themselves in," he says. He's just wary about being the one to sound the alarm.

Rainwater is something of a behind-the-scenes type—at least as far as alpha-male billionaires go. He counts President Bush as a personal friend but dislikes politics, and frankly, when he gets worked up, he says some pretty far-out things that could easily be taken out of context. Such as: An economic tsunami is about to hit the global economy as the world runs out of oil. Or a coalition of communist and Islamic states may decide to stop selling their precious crude to Americans any day now. Or food shortages may soon hit the U.S. Or he read on a blog last night that there's this one gargantuan chunk of ice sitting on a precipice in Antarctica that, if it falls off, will raise sea levels worldwide by two feet—and it's getting closer to the edge.... And then he'll interrupt himself: "Look, I'm not predicting anything," he'll say. "That's when you get a little kooky-sounding."

Rainwater is no crackpot. But you don't get to be a multibillionaire investor—one who's more than doubled his net worth in a decade—through incremental gains on little stock trades. You have to push way past conventional thinking, test the boundaries of chaos, see events in a bigger context. You have to look at all the scenarios, from "A to friggin' Z," as he says, and not be afraid to focus on Z. Only when you've vacuumed up as much information as possible and you know the world is at a major inflection point do you put a hell of a lot of money behind your conviction.

Such insights have allowed Rainwater to turn moments of cataclysm into gigantic paydays before. In the mid-1990s he saw panic selling in Houston real estate and bought some 15 million square feet; now the properties are selling for three times his purchase price. In the late '90s, when oil seemed plentiful and its price had fallen to the low teens, he bet hundreds of millions—by investing in oil stocks and futures—that it would rise. A billion dollars later, that move is still paying off. "Most people invest and then sit around worrying what the next blowup will be," he says. "I do the opposite. I wait for the blowup, then invest."

The next blowup, however, looms so large that it scares and confuses him. For the past few months he's been holed up in hard-core research mode—reading books, academic studies, and, yes, blogs. Every morning he rises before dawn at one of his houses in Texas or South Carolina or California (he actually owns a piece of Pebble Beach Resorts) and spends four or five hours reading sites like LifeAftertheOilCrash.net or DieOff.org, obsessively following links and sifting through data. How worried is he? He has some $500 million of his $2.5 billion fortune in cash, more than ever before. "I'm long oil and I'm liquid," he says. "I've put myself in a position that if the end of the world came tomorrow I'd kind of be prepared." He's also ready to move fast if he spots an opening.

His instincts tell him that another enormous moneymaking opportunity is about to present itself, what he calls a "slow pitch down the middle." But, at 61, wealthier and happier than ever before, Rainwater finds himself reacting differently this time. He's focused more on staying rich than on getting richer. But there's something else too: a sort of billionaire-style civic duty he feels to get a conversation started. Why couldn't energy prices skyrocket, with grave repercussions, not just economic but political? As industry analysts debate whether the world's oil production is destined to decline, the prospect makes him itchy.

"This is a nonrecurring event," he says. "The 100-year flood in Houston real estate was one, the ability to buy oil and gas really cheap was another, and now there's the opportunity to do something based on a shortage of natural resources. Can you make money? Well, yeah. One way is to just stay long domestic oil. But there may be something more important than making money. This is the first scenario I've seen where I question the survivability of mankind. I don't want the world to wake up one day and say, 'How come some doofus billionaire in Texas made all this money by being aware of this, and why didn't someone tell us?'"
Global imbalances, the U.S. dollar, unsound fiscal policies, raging commodities markets, a real estate crash, and Rome burning all seem to be manageable, but an economic tsunami as the world runs out of oil?

That sounds like something that we should keep an eye on.

Read more...

A Different Kind of Measured

Tuesday, December 13, 2005

Today's Federal Reserve policy statement has been officially filed under "WTF?"
The reason? The all important use of the word 'measured' has transitioned from "policy accommodation can be removed at a pace that is likely to be measured" to "some further measured policy firming is likely to be needed".


Click to enlarge

Somehow this nuanced, interim, transitional wordsmithing seems to be woefully inadequate for today's economic realities - realities that, unfortunately, many observers fail to see due to the bright lights of 4.3 percent economic growth, 5 percent unemployment, and a 2 percent core rate of inflation - the oft discussed rosy headline statistics.

Let's contrast the subtle changes in today's Fed policy statement with two stories that have come to our attention recently:

1 - Yesterday's monetary policy transparency discussion where praise was unabashedly heaped on Bank of New Zealand Governor Allan Bollard for saying what few other central bankers would dare utter:

In recent months, Mr. Bollard has said he is intent on raising interest rates "in a way that really hurts," in order to prevent people from borrowing more money against their homes - to prevent them from digging bigger holes for themselves, as Anglo-Saxons, for some reason, are wont to do. "People need to stop using their homes as a source of cash", Bollard told Radio New Zealand last month, where home prices have continued to rise at double digit rates.
2 - Comments in today's post at recent blogroll addition, Another F**ked Borrower, where a Southern California mortgage insider tells sordid tales daily about our debt addicted society:
It's GROUNDHOG DAY!!

Not really, but it sure seems like it. Of the 8 loans I looked at today 6 were stated and 2 were full doc. The "full docness" of the loans was about all they had going for them. On one, the bwr had multiple mortgage lates, and a sub 520 FICO score. At least the LTV was under 60%. At least I could actully price that loan out. It wasn't a great rate, but it was a decent diving or gymnastics score! On the other full doc deal, the bwr, who incidentally refi'd only 5 months ago, wanted to do a 100% refi, to pull the last remaining 10-15k out of his property.
Does anyone else conjure up images of Nero fiddling when the Fed speaks these days?
Nearly everyone has heard of Nero "fiddling while Rome burned". The true story of The Great Fire of 64 is debated but many believe Nero had the fire started to build his monumental "Golden House". There were reports that Nero climbed a tower in a stage costume and played the lyre while exulting in "the beauty of the flames".
Yes, this is a stretch, but why stop now? Nero's house -> Greenspan's legacy.


Read more...

Hummer Overfloweth Still

Microsoft Excel is a wonderful software program. Not only can you easily analyze data using simple equations and formulas, but with a little practice you can become adept at using some of the more advanced features like worksheet functions and charts.

These tools can be useful in looking for patterns or similarities between sets of data and then expressing the findings in graphical form. For example, from Microsoft Excel Help (F1), details of the worksheet function MATCH are quickly revealed:

MATCH
Returns the relative position of an item in an array that matches a specified value in a specified order. Use MATCH instead of one of the LOOKUP functions when you need the position of an item in a range instead of the item itself.

Syntax
MATCH(lookup_value, lookup_array, match_type)
Something like this could conceivably be very handy for say, a software engineer with a blog who took some pictures of the local Hummer dealer's inventory, then wrote a mostly tongue-in-cheek story about how the Hummer inventory looked ridiculously large, and who now wants to check back and see how the H2s and H3s have been selling in the month that has passed.

Of course, Microsoft Excel can do nothing without the raw data - that's where the Thousand Oaks (California) Hummer website comes in. If you are looking for information about the Hummer dealer in this area or if you want to quickly get to Hummer.com to see some really cool pictures of Hummers and learn about Hummer specifications and such, this is a great resource - our interest is limited to the online inventory data:
Our entire HUMMER inventory is now online. You can easily search our New and Pre-Owned vehicles by clicking on the Inventory tab above. Please let us know if you do not find the exact vehicle you are looking for. Check out our Specials.
[Note: This inventory data is presumed to be accurate. No attempt was made to contact the dealer to confirm this, as that may have spoilt all the fun. It was clear that inventory had been removed and added since it was last checked, so, that seemed to be evidence enough that someone was updating the inventory - plus, the whole idea of talking to a Hummer salesman or the sales manager held little appeal.]

Data Please

So, when we left our Hummer saga last month, the inventory data as of November 7th was collected and dutifully posted on this blog under the catchy title Epilogue (For Now) - open-ended, non-committal, the title seems to have worked out well, given what was found when the inventory data was collected again on December 10th.

The December 10th data appears in the previous post for the benefit of anyone with time on their hands who wants to look it over - feel free. Maybe there are other interesting conclusions that can be drawn from this data - perhaps there are color or price trends that are worth investigating. All that concerns us are the numbers, and in particular the stock numbers - what was there a month ago and what's still there.

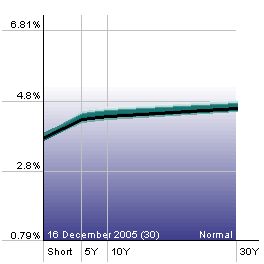
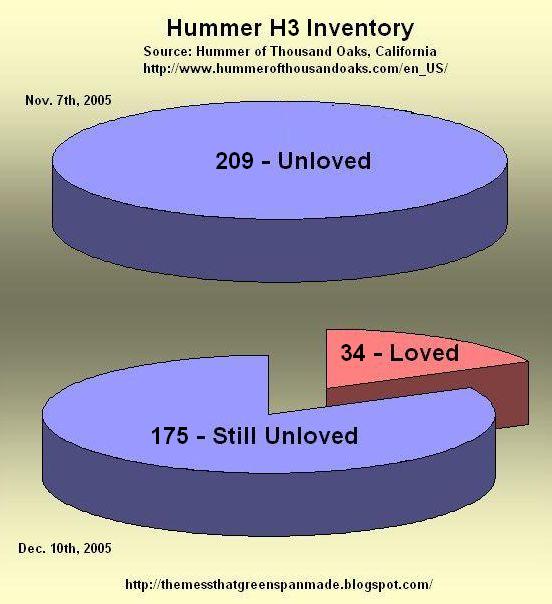
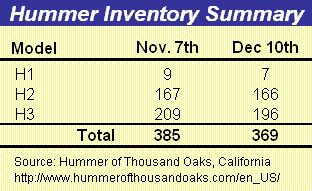
The overall count is shown in the table to the left. In and of itself these numbers are mostly uninteresting - a net decrease of 16 Hummers during this time, so what?

What we are mostly interested in is Hummer love - that is, how many Hummers are still in the dealer's remote lots, sitting there waiting for someone to take them home and love them, and how many have actually been taken home and are experiencing true love for the first time.

With the holidays right around the corner, gasoline prices moderating, and with credit still relatively cheap, it seems that every one of these behemoths should be in a warm garage somewhere or destined for one soon, instead of developing a thin layer Southern California grime in the back lot of a hotel (yes, we know, H2s don't fit into garages, but then, what H2 owner would want to deprive the rest of the neighborhood of it's majestic beauty anyway?)

To answer this question of love, the two sets of inventory data were loaded into Microsoft Excel, the previously described Match function was engaged, and the following charts were created.


A total of 29 H2s that were there last month are now absent (eight of the absent H2s had stock numbers beginning with D, which presumably means "Dealer" - the significance of their absence is not known - they are included in the total of 29, however it is not known if they are currently being loved).

So, that would be 29 H2s out of 167 or roughly 17 percent. Added back into this inventory during the last month were 28 new H2s, so, as indicated in the table, the recent count is one shy of the total from November. At this rate of sales, with the current inventory, this is a six month supply of H2s.

The Pre-Shrunk Version

The H3 inventory data is surprisingly similar, the numbers are just scaled up a bit. A total of 34 H3s are gone, out of a November total of 209 for a similar 16 percent sales rate and a six month supply of H3s. In the case of the H3, only 21 H3s are new arrivals bringing the current total back up to 196.


So, what do all these pie-charts mean?

It's very simple, and it's already been stated twice - based on the inventory data posted by the dealer on their website, they have a six month supply of Hummers.

Is that a lot to have on your lot?

Well, after the appearance of our first Hummer story last month, we were contacted by a number of journalists who cover the auto industry for a living, and yes, apparently it is a lot. Dealers prefer to have inventory to cover a month or two - forty five days is typical. Given the sales rate of the last month, that would work out to be a lot closer to 100 Hummers than 400 Hummers.

When Hummers were leaving the dealership at the rate of 150 or so a month, the current inventory would make a lot more sense, but at less than half that rate, it's just a lot of inventory.

Read more...

Hummer Inventory Update

This is the Hummer inventory from the Hummer of Thousand Oaks website, as of Saturday, Dec 10th, 2005. The inventory search was done using the default values New/Used: New and Make: Hummer. See the next post for how this data is used.

THE SUMMARY

H1 - 7 (all 2006)
H2 - 166 (23-2005, 143-2006)
H3 - 196 (all 2006)

THE LIST

1.....2006....OPEN...SPTUTY.50200....BLACK....$135,125
2.....2006....OPEN...SPTUTY.50202....RED......$135,125
3.....2006....H1.....SUV....50205....PEWTER...$146,523
4.....2006....H1.....SUV....50207....PEWTER...$146,523
5.....2006....H1.....SUV....50209....SAND.....$146,523
6.....2006....H1.....SUV....50210....WHITE....$146,523
7.....2006....H1.....SUV....50211....PEWTER...$146,523
8.....2005....H2.....SPTUTY.70925....BLACK.....$82,493
9.....2005....H2-SUT.SUV....71046....WHITE.....$56,489
10....2005....H2-SUT.SUV....71095....YELLOW....$59,389
11....2005....H2-SUT.SUV....71147....RED.......$58,500
12....2005....H2-SUT.SUV....71169....RED.......$53,354
13....2005....H2-SUT.SUV....71174....YELLOW....$56,330
14....2005....H2.....SPTUTY.71478....RED.......$59,470
15....2006....H3.....SUV....71492....50U.......$33,660
16....2006....H3.....SUV....71520....50U.......$34,905
17....2006....H3.....SUV....71526....31U.......$31,590
18....2006....H3.....SUV....71539....WHITE.....$35,055
19....2006....H3.....SUV....71549....YELLOW....$37,110
20....2006....H3.....SUV....71551....RED.......$29,500
21....2005....H2.....SPTUTY.71555....PEWTER....$60,280
22....2005....H2-SUT.SUV....71562....SAND......$59,010
23....2006....H3.....SUV....71575....WHITE.....$35,055
24....2005....H2.....SPTUTY.71610....PEWTER....$61,480
25....2006....H3.....SUV....71613....RED.......$37,460
26....2006....H3.....SUV....71630....RED.......$35,055
27....2006....H3.....SUV....71634....YELLOW....$37,460
28....2006....H3.....SUV....71640....YELLOW....$37,460
29....2006....H3.....SUV....71650....YELLOW....$34,730
30....2006....H3.....SUV....71654....RED.......$35,055
31....2006....H3.....SUV....71667....RED.......$37,460
32....2006....H3.....SUV....71672....RED.......$37,460
33....2006....H3.....SUV....71673....BLACK.....$38,060
34....2006....H3.....SUV....71674....BLACK.....$38,060
35....2006....H3.....SUV....71676....WHITE.....$38,060
36....2006....H3.....SUV....71677....WHITE.....$38,060
37....2006....H3.....SUV....71678....WHITE.....$38,060
38....2006....H3.....SUV....71691....METALLIC..$38,060
39....2005....H2-SUT.SUV....71703....PEWTER....$60,170
40....2006....H3.....SUV....71706....BLACK.....$38,060
41....2006....H3.....SUV....71707....RED.......$38,060
42....2006....H3.....SUV....71708....WHITE.....$38,060
43....2006....H3.....SUV....71709....WHITE.....$38,060
44....2006....H3.....SUV....71710....METALLIC..$38,060
45....2006....H3.....SUV....71711....METALLIC..$38,060
46....2006....H3.....SUV....71712....METALLIC..$38,060
47....2006....H3.....SUV....71713....METALLIC..$38,060
48....2006....H3.....SUV....71720....BLACK.....$38,060
49....2006....H2.....SPTUTY.71731....MAROON....$60,315
50....2006....H3.....SUV....71733....BLACK.....$32,235
51....2006....H2.....SPTUTY.71734....PEWTER....$60,315
52....2006....H2.....SPTUTY.71735....PEWTER....$60,315
53....2006....H2.....SPTUTY.71736....MAROON....$60,315
54....2006....H2.....SPTUTY.71737....MAROON....$60,315
55....2006....H2.....SPTUTY.71738....MAROON....$60,315
56....2006....H2.....SPTUTY.71739....MAROON....$60,315
57....2006....H2.....SPTUTY.71740....MAROON....$61,590
58....2006....H2-SUT.SUV....71754....PEWTER....$61,590
59....2006....H2.... SPTUTY.71758....BLACK.....$57,535
60....2006....H3.....SUV....71760....WHITE.....$32,490
61....2006....H3.....SUV....71762....RED.......$31,465
62....2006....H3.....SUV....71765....RED.......$31,465
63....2006....H3.....SUV....71766....RED.......$31,465
64....2006....H3.....SUV....71767....RED.......$31,465
65....2006....H3.....SUV....71769....RED.......$31,465
66....2006....H3.....SUV....71770....WHITE.....$32,490
67....2006....H3.....SUV....71772....WHITE.....$32,490
68....2006....H3.....SUV....71773....WHITE.....$32,490
69....2006....H3.....SUV....71774....WHITE.....$32,490
70....2006....H3.....SUV....71775....RED.......$31,465
71....2006....H3.....SUV....71777....RED.......$31,465
72....2006....H3.....SUV....71778....WHITE.....$32,490
73....2006....H3.....SUV....71779....WHITE.....$32,490
74....2006....H3.....SUV....71780....WHITE.....$32,490
75....2006....H3.....SUV....71781....RED.......$31,465
76....2006....H3.....SUV....71782....WHITE.....$32,490
77....2006....H3.....SUV....71783....WHITE.....$32,490
78....2006....H3.....SUV....71786....METALLIC..$37,010
79....2006....H3.....SUV....71788....METALLIC..$37,010
80....2006....H3.....SUV....71791....WHITE.....$37,610
81....2006....H3.....SUV....71792....WHITE.....$37,610
82....2006....H3.....SUV....71793....RED.......$31,465
83....2006....H3.....SUV....71794....METALLIC..$37,010
84....2006....H2.....SPTUTY.71796....BLUE......$60,665
85....2006....H2.....SPTUTY.71797....BLUE......$60,665
86....2006....H3.....SUV....71802....RED.......$37,610
87....2006....H3.....SUV....71803....WHITE.....$37,610
88....2006....H3.....SUV....71804....METALLIC..$37,610
89....2006....H3.....SUV....71805....YELLOW....$37,610
90....2006....H2-SUT.SUV....71806....BLUE......$61,190
91....2006....H3.....SUV....71807....RED.......$31,465
92....2006....H3.....SUV....71810....BLACK.....$37,610
93....2006....H3.....SUV....71811....BLUE......$37,610
94....2006....H3.....SUV....71812....RED.......$37,610
95....2006....H3.....SUV....71813....RED.......$37,610
96....2006....H3.....SUV....71817....METALLIC..$37,610
97....2006....H3.....SUV....71819....BLUE......$37,610
98....2006....H3.....SUV....71822....BLACK.....$37,010
99....2006....H3.....SUV....71823....BLACK.....$37,010
100...2006....H3.....SUV....71824....BLACK.....$37,610
101...2006....H2.....SPTUTY.71825....MAROON....$60,665
102...2006....H2.....SPTUTY.71827....MAROON....$60,665
103...2006....H2.....SPTUTY.71828....WHITE.....$60,920
10....2006....H3.....SUV....71829....BLUE......$37,610
105...2006....H3.....SUV....71832....WHITE.....$37,610
106...2006....H2.....SPTUTY.71837....WHITE.....$60,920
107...2006....H3.....SUV....71839....BLUE......$37,010
108...2006....H3.....SUV....71840....BLUE......$37,610
109...2006....H3.....SUV....71841....BLUE......$37,610
110...2006....H3.....SUV....71842....BLUE......$37,610
111...2006....H3.....SUV....71843....BLUE......$37,610
112...2006....H3.....SUV....71844....BLACK.....$37,610
113...2006....H3.....SUV....71846....WHITE.....$37,610
114...2006....H3.....SUV....71848....GREEN.....$35,075
115...2006....H3.....SUV....71849....YELLOW....$35,075
116...2006....H2.....SPTUTY.71851....BLACK.....$60,920
117...2006....H2.....SPTUTY.71852....BLACK.....$60,920
118...2006....H2.....SPTUTY.71853....BLACK.....$60,920
119...2006....H3.....SUV....71854....BLACK.....$34,270
120...2006....H3.....SUV....71855....GRAY......$34,670
121...2006....H3.....SUV....71856....BLACK.....$34,670
122...2006....H3.....SUV....71857....WHITE.....$34,945
123...2006....H2.....SPTUTY.71858....BLACK.....$59,795
124...2006....H2.....SPTUTY.71863....BLUE......$59,795
125...2006....H2.....SPTUTY.71864....BLUE......$59,795
126...2006....H2.....SPTUTY.71865....BLUE......$59,795
127...2006....H2.....SPTUTY.71868....BLACK.....$60,920
128...2006....H2.....SPTUTY.71869....BLACK.....$60,920
129...2006....H2.....SPTUTY.71870....BLACK.....$60,920
130...2006....H2.....SPTUTY.71871....WHITE.....$60,920
131...2006....H2.....SPTUTY.71872....WHITE.....$60,920
132...2006....H2.....SPTUTY.71874....BLACK.....$59,645
133...2006....H2.....SPTUTY.71875....BLACK.....$59,645
134...2006....H3.....SUV....71876....BLUE......$37,010
135...2006....H3.....SUV....71877....BLUE......$37,355
136...2006....H3.....SUV....71879....BLUE......$37,610
137...2006....H3.....SUV....71880....BLACK.....$35,075
138...2006....H3.....SUV....71881....BLACK.....$35,075
139...2006....H2.....SPTUTY.71882....BLACK.....$60,920
140...2006....H3.....SUV....71885....BLACK.....$34,670
141...2006....H3.....SUV....71887....GRAY......$34,670
142...2006....H3.....SUV....71888....YELLOW....$33,875
143...2006....H2.....SPTUTY.71889....BLACK.....$60,920
144...2006....H3.....SUV....71890....BLUE......$37,010
145...2006....H3.....SUV....71892....RED.......$35,075
146...2006....H3.....SUV....71893....GRAY......$34,670
147...2006....H3.....SUV....71894....BLACK.....$34,670
148...2006....H3.....SUV....71895....BLUE......$34,670
149...2006....H3.....SUV....71896....RED.......$33,605
150...2006....H3.....SUV....71897....RED.......$33,230
151...2006....H2.....SPTUTY.71902....BLACK.....$60,920
152...2006....H2.....SPTUTY.71907....YELLOW....$62,095
153...2006....H2-SUT.SUV....71909....BLUE......$61,190
154...2006....H3.....SUV....71911....BLUE......$33,030
155...2006....H2.....SPTUTY.71912....BLACK.....$60,935
156...2006....H2.....SPTUTY.71913....BLACK.....$60,935
157...2006....H2.....SPTUTY.71916....BLACK.....$59,795
158...2006....H2.....SPTUTY.71940....WHITE.....$60,935
159...2006....H2.....SPTUTY.71942....BLUE......$59,795
160...2006....H2.....SPTUTY.71945....MAROON....$62,615
161...2005....H2-SUT.SUV....71947....SAND......$59,160
162...2006....H3.....SUV....71951....BLUE......$36,960
163...2006....H2-SUT.SUV....71953....BLUE......$61,190
164...2006....H3.....SUV....71954....GRAY......$34,670
165...2006....H3.....SUV....71955....WHITE.....$34,170
166...2006....H2.....SPTUTY.71957....BLUE......$62,615
167...2006....H2.....SPTUTY.71958....BLUE......$62,615
168...2006....H2.....SPTUTY.71961....BLACK.....$62,615
169...2006....H2.....SPTUTY.71962....WHITE.....$62,615
170...2006....H2.....SPTUTY.71963....SAND......$62,615
171...2006....H3.....SUV....71974....GRAY......$37,405
172...2006....H3.....SUV....71976....RED.......$37,405
173...2006....H3.....SUV....71977....RED.......$37,405
174...2006....H3.....SUV....71984....BLUE......$37,010
175...2006....H3.....SUV....71985....GRAY......$34,170
176...2006....H3.....SUV....71991....BLACK.....$36,195
177...2006....H3.....SUV....71992....BLUE......$36,195
178...2006....H3.....SUV....71993....BLUE......$35,370
179...2006....H3.....SUV....71995....BLUE......$35,795
180...2006....H3.....SUV....71996....BLUE......$35,795
181...2006....H3.....SUV....71997....BLUE......$35,795
182...2006....H3.....SUV....71998....BLACK.....$35,595
183...2006....H3.....SUV....71999....BLACK.....$35,595
184...2006....H3.....SUV....72000....BLACK.....$35,595
185...2006....H3.....SUV....72001....BLACK.....$35,195
186...2006....H3.....SUV....72004....GRAY......$35,595
187...2006....H3.....SUV....72005....GRAY......$35,595
188...2006....H2.....SPTUTY.72006....MAROON....$62,615
189...2006....H2.....SPTUTY.72009....BLACK.....$62,615
190...2006....H3.....SUV....72012....BLACK.....$35,595
191...2006....H3.....SUV....72014....WHITE.....$37,405
192...2006....H3.....SUV....72016....RED.......$37,405
193...2006....H2-SUT.SUV....72026....BLACK.....$60,470
194...2006....H2.....SPTUTY.72028....PEWTER....$59,795
195...2006....H2.....SPTUTY.72030....PEWTER....$59,795
196...2006....H2.....SPTUTY.72031....BLUE......$59,795
197...2006....H2.....SPTUTY.72032....BLUE......$59,795
198...2006....H2.....SPTUTY.72033....BLUE......$59,795
199...2006....H2.....SPTUTY.72037....SAND......$59,795
200...2006....H2.....SPTUTY.72038....SAND......$59,795
201...2006....H3.....SUV....72040....BLACK.....$38,260
202...2006....H2.....SPTUTY.72041....BLACK.....$61,215
203...2006....H3......SUV....72044....WHITE....$38,930
204...2006....H3.....SUV....72045....BLACK.....$35,095
205...2006....H2.....SPTUTY.72047....MAROON....$59,795
206...2006....H3.....SUV....72050....BLACK.....$38,260
207...2006....H3.....SUV....72052....BLUE......$33,300
208...2006....H3.....SUV....72053....GRAY......$33,695
209...2006....H3.....SUV....72054....GRAY......$34,290
210...2006....H3.....SUV....72055....GRAY......$35,465
211...2006....H3.....SUV....72056....BLACK.....$35,965
212...2006....H3.....SUV....72057....BLACK.....$35,965
213...2006....H3.....SUV....72058....BLACK.....$35,965
214...2006....H3.....SUV....72060....WHITE.....$34,870
215...2006....H3.....SUV....72061....WHITE.....$38,850
216...2006....H3.....SUV....72062....WHITE.....$38,850
217...2006....H3.....SUV....72063....BLUE......$38,850
218...2006....H3.....SUV....72064....WHITE.....$33,970
219...2006....H3.....SUV....72065....RED.......$33,550
220...2006....H3.....SUV....72067....WHITE.....$39,450
221...2006....H3.....SUV....72068....WHITE.....$38,930
222...2006....H3.....SUV....72069....YELLOW....$38,700
223...2006....H3.....SUV....72074....GRAY......$38,330
224...2006....H2.....SPTUTY.72077....SAND......$62,615
225...2006....H3.....SUV....72081....YELLOW....$37,580
226...2006....H2-SUT.SUV....72082....BLACK.....$59,520
227...2006....H2-SUT.SUV....72083....WHITE.....$60,470
228...2006....H2-SUT.SUV....72084....MAROON....$60,470
229...2006....H2-SUT.SUV....72085....SAND......$59,520
230...2006....H2-SUT.SUV....72086....WHITE.....$59,890
231...2006....H2.....SPTUTY.72087....SAND......$59,795
232...2006....H2.....SPTUTY.72088....BLACK.....$59,795
233...2006....H2.....SPTUTY.72089....BLACK.....$59,795
234...2006....H2.....SPTUTY.72090....BLACK.....$59,795
235...2006....H2.....SPTUTY.72091....MAROON....$59,795
236...2006....H2-SUT.SUV....72092....BLACK.....$57,650
237...2006....H3.....SUV....72095....BLACK.....$36,460
238...2006....H3.....SUV....72101....BLUE......$38,180
239...2006....H3.....SUV....72102....BLUE......$38,455
240...2006....H3.....SUV....72105....YELLOW....$38,850
241...2006....H3.....SUV....72106....BLUE......$38,850
242...2006....H2.....SPTUTY.72109....BLACK.....$59,645
243...2006....H2.....SPTUTY.72110....BLACK.....$61,070
244...2006....H2.....SPTUTY.72113....BLACK.....$68,130
245...2006....H2.....SPTUTY.72114....BLACK.....$59,645
246...2006....H2.....SPTUTY.72115....WHITE.....$59,645
247...2006....H3.....SUV....72116....BLACK.....$38,460
248...2006....H2.....SPTUTY.72117....BLACK.....$59,645
249...2006....H2.....SPTUTY.72118....PEWTER....$61,070
250...2006....H2.....SPTUTY.72119....SAND......$59,645
251...2006....H2.....SPTUTY.72120....BLUE......$61,070
252...2006....H2.....SPTUTY.72122....BLACK.....$59,645
253...2006....H2.....SPTUTY.72123....WHITE.....$59,645
254...2006....H3.....SUV....72124....BLACK.....$35,375
255...2006....H3.....SUV....72125....BLACK.....$35,375
256...2006....H3.....SUV....72126....BLACK.....$35,375
257...2006....H3.....SUV....72129....GRAY......$38,180
258...2006....H3.....SUV....72130....GRAY......$38,780
259...2006....H2.....SPTUTY.72131....BLACK.....$63,783
260...2006....H2.....SPTUTY.72132....BLUE......$66,530
261...2006....H3.....SUV....72134....BLACK.....$37,510
262...2006....H3.....SUV....72136....BLACK.....$38,460
263...2006....H3.....SUV....72137....BLACK.....$38,460
264...2006....H2.....SPTUTY.72138....BLACK.....$59,645
265...2006....H2-SUT.SUV....72139....PEWTER....$60,240
266...2006....H2-SUT.SUV....72140....YELLOW....$57,800
267...2006....H2-SUT.SUV....72142....WHITE.....$60,240
268...2006....H2-SUT.SUV....72143....PEWTER....$60,240
269...2006....H2.....SPTUTY.72144....BLACK.....$60,920
270...2006....H2.....SPTUTY.72145....BLACK.....$60,920
271...2006....H2.....SPTUTY.72146....WHITE.....$60,920
272...2006....H3.....SUV....72148....GRAY......$38,850
273...2006....H3.....SUV....72149....BLUE......$38,850
274...2006....H3.....SUV....72150....BLUE......$38,130
275...2006....H3.....SUV....72152....BLUE......$38,130
276...2006....H3.....SUV....72153....BLUE......$38,130
277...2006....H3.....SUV....72154....BLACK.....$38,180
278...2006....H3.....SUV....72155....GRAY......$39,730
279...2006....H2.....SPTUTY.72156....BLUE......$66,530
280...2006....H3.....SUV....72157....BLACK.....$37,510
281...2006....H2-SUT.SUV....72158....BLACK.....$59,945
282...2006....H2-SUT.SUV....72159....BLACK.....$60,240
283...2006....H2.....SPTUTY.72160....BLACK.....$60,920
284...2006....H2.....SPTUTY.72161....BLACK.....$60,920
285...2006....H2.....SPTUTY.72162....BLACK.....$59,645
286...2006....H2.....SPTUTY.72163....BLACK.....$59,645
287...2006....H2.....SPTUTY.72164....WHITE.....$60,920
288...2006....H3.....SUV....72165....WHITE.....$38,850
289...2006....H3.....SUV....72169....YELLOW....$38,700
290...2006....H3.....SUV....72170....YELLOW....$37,675
291...2006....H3.....SUV....72171....YELLOW....$37,675
292...2006....H3.....SUV....72173....RED.......$37,005
293...2006....H3.....SUV....72174....BLACK.....$37,675
294...2006....H3.....SUV....72176....GRAY......$29,500
295...2006....H2.....SPTUTY.72178....WHITE.....$59,645
296...2006....H2-SUT.SUV....72179....SAND......$60,240
297...2006....H2-SUT.SUV....72180....WHITE.....$60,240
298...2006....H2-SUT.SUV....72181....BLACK.....$60,240
299...2006....H2.....SPTUTY.72182....BLACK.....$68,130
300...2006....H2.....SPTUTY.72183....YELLOW....$61,070
301...2006....H2.....SPTUTY.72184....BLUE......$59,645
302...2006....H2.....SPTUTY.72185....SAND......$59,645
303...2006....H2.....SPTUTY.72187....BLUE......$59,645
304...2006....H2.....SPTUTY.72188....MAROON....$59,645
305...2006....H2.....SPTUTY.72189....SAND......$61,070
306...2006....H2.....SPTUTY.72191....BLUE......$61,070
307...2006....H2.....SPTUTY.72192....WHITE.....$68,130
308...2006....H2.....SPTUTY.72193....BLACK.....$60,920
309...2006....H2.....SPTUTY.72194....WHITE.....$59,261
310...2006....H2-SUT.SUV....72195....BLACK.....$58,670
311...2006....H3.....SUV....72197....YELLOW....$38,850
312...2006....H3.....SUV....72198....BLACK.....$37,675
313...2006....H3.....SUV....72199....BLUE......$37,675
314...2006....H3.....SUV....72200....WHITE.....$37,675
315...2006....H3.....SUV....72201....WHITE.....$37,005
316...2006....H3.....SUV....72202....RED.......$37,005
317...2006....H2-SUT.SUV....72203....BLUE......$57,650
318...2006....H3.....SUV....72204....BLACK.....$37,510
319...2006....H3.....SUV....72205....BLACK.....$37,510
320...2006....H2.....SPTUTY.72206....PEWTER....$59,645
321...2006....H2.....SPTUTY.72207....WHITE.....$59,645
322...2006....H2.....SPTUTY.72208....PEWTER....$61,070
323...2006....H2.....SPTUTY.72211....BLACK.....$68,130
324...2006....H2.....SPTUTY.72212....BLACK.....$59,645
325...2006....H2.....SPTUTY.72213....BLACK.....$59,645
326...2006....H2.....SPTUTY.72214....WHITE.....$59,645
327...2006....H2.....SPTUTY.72215....WHITE.....$59,645
328...2006....H2.....SPTUTY.72216....BLACK.....$59,645
329...2006....H2.....SPTUTY.72217....WHITE.....$54,055
330...2006....H3.....SUV....72218....BLACK.....$38,135
331...2006....H3.....SUV....72220....GRAY......$33,300
332...2006....H2.....SPTUTY.72221....BLACK.....$59,645
333...2006....H2.....SPTUTY.72222....WHITE.....$59,645
334...2006....H2-SUT.SUV....72223....BLUE......$54,360
335...2006....H2.....SPTUTY.72224....BLACK.....$54,055
336...2006....H3.....SUV....72225....BLUE......$39,055
337...2006....H3.....SUV....72227....BLACK.....$38,460
338...2006....H2.....SPTUTY.72229....WHITE.....$54,055
339...2006....H2.....SPTUTY.72230....BLACK.....$68,130
340...2006....H2-SUT.SUV....72231....PEWTER....$56,580
341...2006....H3.....SUV....72236....GRAY......$37,675
342...2006....H3.....SUV....72237....RED.......$37,675
343...2006....H3.....SUV....72238....WHITE.....$33,300
344...2006....H3.....SUV....72239....BLUE......$33,300
345...2006....H3.....SUV....72240....BLACK.....$37,675
346...2006....H3.....SUV....72241....BLACK.....$38,460
347...2006....H2.....SPTUTY.72242....WHITE.....$54,055
348...2006....H2.....SPTUTY.72243....BLACK.....$68,130
349...2006....H2.....SPTUTY.72248....BLACK.....$57,535
350...2006....H2.....SPTUTY.72250....PEWTER....$58,095
351...2006....H2.....SPTUTY.72251....YELLOW....$58,095
352...2006....H2.....SPTUTY.72252....BLACK.....$54,355
353...2005....H2-SUT.SUV....U71176...WHITE.....$53,204
354...2006....H3.....SUV....U71764...RED.......$31,465
355...2005....H2-SUT.SUV....D71479...PEWTER....$59,595
356...2005....H2-SUT.SUV....D71921...GRAY......$62,518
357...2005....H2.....SPTUTY.D71928...GRAY......$60,935
358...2005....H2-SUT.SUV....D71929...GRAY......$59,160
359...2005....H2-SUT.SUV....D71930...PEWTER....$58,165
360...2006....H3.....SUV....D71931...YELLOW....$35,525
361...2005....H2.....SPTUTY.D71933...GRAY......$61,635
362...2005....H2-SUT.SUV....D71934...BLACK.....$60,435
363...2005....H2-SUT.SUV....D71935...WHITE.....$59,985
364...2005....H2-SUT.SUV....D71936...BLACK.....$59,735
365...2005....H2.....SPTUTY.D71938...YELLOW....$58,185
366...2006....H3.....SUV....D72196...RED.......$35,305
367...2006....H2.....SPTUTY.D72232...YELLOW....$57,980
368...2006....H2.....SPTUTY.D72233...PEWTER....$57,225
369...2006....H3.....SUV....D72235...BLUE......$37,055

Read more...
IMAGE

  © Blogger template Newspaper by Ourblogtemplates.com 2008

Back to TOP